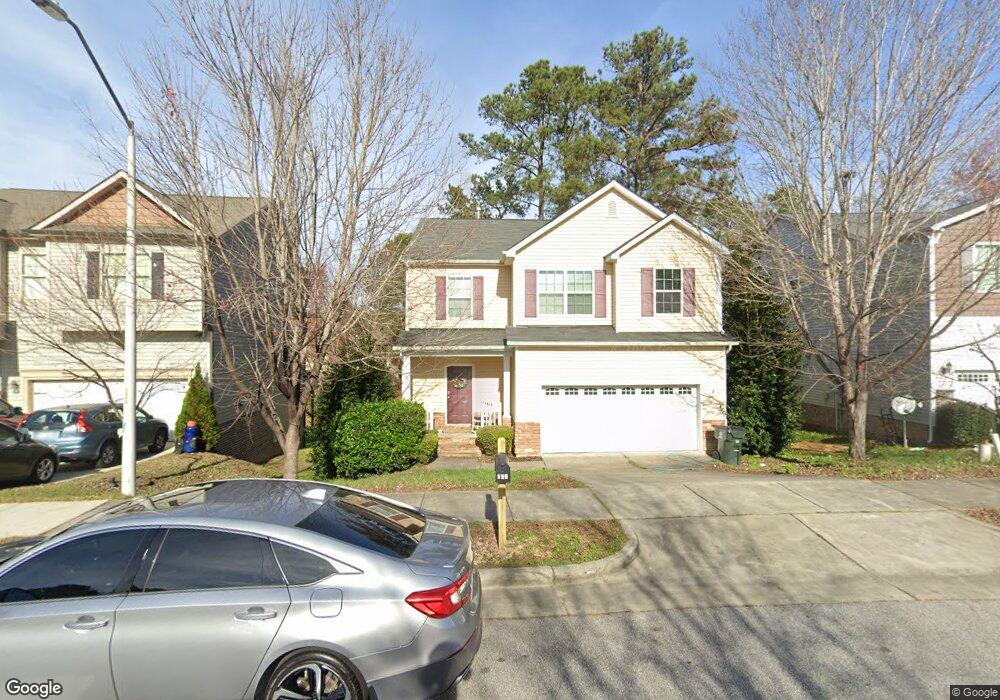
115 Switchback St Unit LOT8 Knightdale, NC 27545
Estimated Value: $376,080 - $388,000
4
Beds
3
Baths
2,290
Sq Ft
$167/Sq Ft
Est. Value
About This Home
This home is located at 115 Switchback St Unit LOT8, Knightdale, NC 27545 and is currently estimated at $383,270, approximately $167 per square foot. 115 Switchback St Unit LOT8 is a home located in Wake County with nearby schools including Knightdale Elementary School, Neuse River Middle School, and Knightdale High.
Ownership History
Date
Name
Owned For
Owner Type
Purchase Details
Closed on
Feb 22, 2018
Sold by
Property Owner Llc A Delaware Limited
Bought by
Birrriwer Origess Resudebtuak
Current Estimated Value
Purchase Details
Closed on
Jan 9, 2017
Sold by
Burrows Kirby J and Burrows Annette L
Bought by
Property Owner 1 Llc
Purchase Details
Closed on
Jul 23, 2012
Sold by
D R Horton Inc
Bought by
Burrows Kirby J and Burrows Annette L
Home Financials for this Owner
Home Financials are based on the most recent Mortgage that was taken out on this home.
Original Mortgage
$188,266
Interest Rate
3.62%
Mortgage Type
FHA
Purchase Details
Closed on
Jun 1, 2011
Sold by
Brookefield Station Development Llc
Bought by
D R Horton Inc
Create a Home Valuation Report for This Property
The Home Valuation Report is an in-depth analysis detailing your home's value as well as a comparison with similar homes in the area
Home Values in the Area
Average Home Value in this Area
Purchase History
| Date | Buyer | Sale Price | Title Company |
|---|---|---|---|
| Birrriwer Origess Resudebtuak | -- | None Available | |
| Property Owner 1 Llc | $215,000 | None Available | |
| Burrows Kirby J | $193,500 | None Available | |
| D R Horton Inc | $115,500 | None Available |
Source: Public Records
Mortgage History
| Date | Status | Borrower | Loan Amount |
|---|---|---|---|
| Previous Owner | Burrows Kirby J | $188,266 |
Source: Public Records
Tax History Compared to Growth
Tax History
| Year | Tax Paid | Tax Assessment Tax Assessment Total Assessment is a certain percentage of the fair market value that is determined by local assessors to be the total taxable value of land and additions on the property. | Land | Improvement |
|---|---|---|---|---|
| 2025 | $3,570 | $370,909 | $85,000 | $285,909 |
| 2024 | $3,557 | $370,909 | $85,000 | $285,909 |
| 2023 | $2,801 | $251,203 | $55,000 | $196,203 |
| 2022 | $2,707 | $251,203 | $55,000 | $196,203 |
| 2021 | $2,582 | $251,203 | $55,000 | $196,203 |
| 2020 | $2,582 | $251,203 | $55,000 | $196,203 |
| 2019 | $2,385 | $205,499 | $38,000 | $167,499 |
| 2018 | $2,248 | $205,499 | $38,000 | $167,499 |
| 2017 | $2,167 | $205,499 | $38,000 | $167,499 |
| 2016 | $2,138 | $205,499 | $38,000 | $167,499 |
| 2015 | $2,144 | $203,335 | $42,000 | $161,335 |
| 2014 | $2,070 | $203,335 | $42,000 | $161,335 |
Source: Public Records
Map
Nearby Homes
- 302 Brakeman St
- 102 Switchback St
- 201 Heathwick Dr
- 216 Walbury Dr
- 116 Carrington Dr
- 413 Laurens Way
- 619 Laurens Way
- 307 S Smithfield Rd
- 117 Stanway Dr
- 506 Sternwheel Way
- 1456 Jay Rd
- 1466 Jay Rd
- 1463 Jay Rd
- 1452 Jay Rd
- 444 Haywood Glen Dr
- 1580 Goldfinch Perch Ln
- 1444 Jay Rd
- 1728 Goldfinch Perch Ln
- 1704 Goldfinch Perch Ln
- 1442 Jay Rd
- 115 Switchback St
- 115 Switchback St
- 113 Switchback St Unit 7
- 113 Switchback St
- 117 Switchback St
- 111 Switchback St
- 119 Switchback St
- 109 Switchback St
- 121 Switchback St
- 101 Cinder St
- 202 Switchback St
- 305 Brakeman St
- 307 Brakeman St
- 605 Brookfield Dr
- 303 Brakeman St
- 103 Cinder St
- 309 Brakeman St
- 201 Switchback St
- 110 Switchback St
- 311 Brakeman St