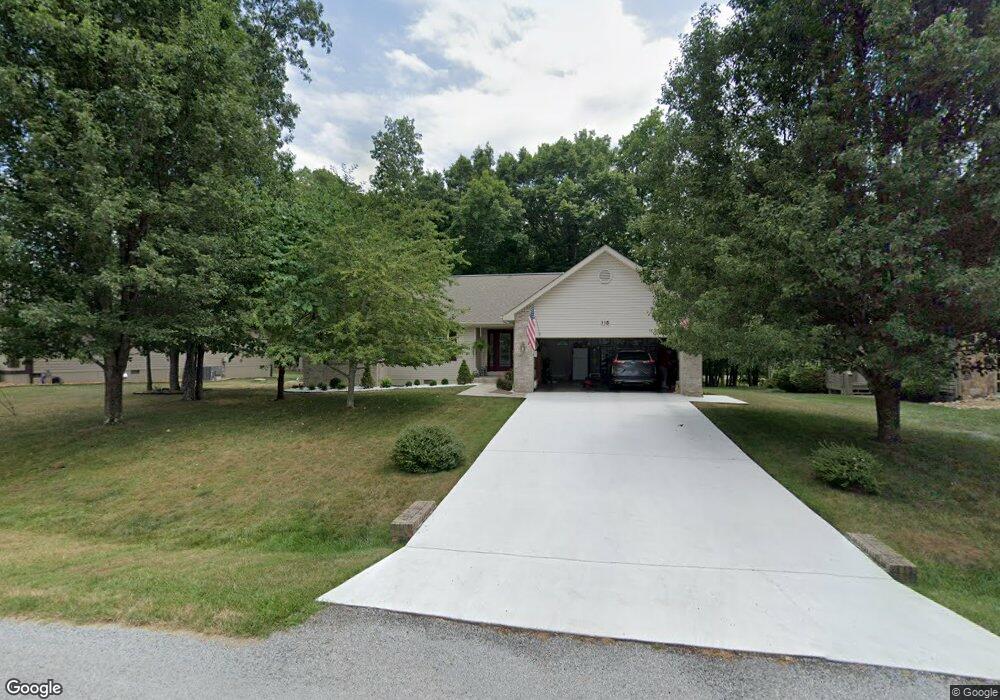
115 Trentwood Dr Crossville, TN 38558
Estimated Value: $398,177 - $471,000
--
Bed
2
Baths
1,814
Sq Ft
$239/Sq Ft
Est. Value
About This Home
This home is located at 115 Trentwood Dr, Crossville, TN 38558 and is currently estimated at $434,044, approximately $239 per square foot. 115 Trentwood Dr is a home located in Cumberland County with nearby schools including Crab Orchard Elementary School and Stone Memorial High School.
Ownership History
Date
Name
Owned For
Owner Type
Purchase Details
Closed on
Sep 13, 2018
Sold by
Andreson Roger L and Edwards Kenneth D
Bought by
Edwards Kenneth D and Edwards Darlene K
Current Estimated Value
Purchase Details
Closed on
Dec 7, 2004
Sold by
Mcdonald Jimmy
Bought by
Edwards Kenneth D
Home Financials for this Owner
Home Financials are based on the most recent Mortgage that was taken out on this home.
Original Mortgage
$85,000
Interest Rate
5.67%
Purchase Details
Closed on
Dec 2, 2004
Bought by
Edwards Kenneth D
Home Financials for this Owner
Home Financials are based on the most recent Mortgage that was taken out on this home.
Original Mortgage
$85,000
Interest Rate
5.67%
Purchase Details
Closed on
Aug 8, 2003
Sold by
Tarter Howard and Tarter Betty
Bought by
Mcdonald Jimmy
Purchase Details
Closed on
Jan 30, 1990
Bought by
Tarter Howard D and Tarter Betty V
Create a Home Valuation Report for This Property
The Home Valuation Report is an in-depth analysis detailing your home's value as well as a comparison with similar homes in the area
Home Values in the Area
Average Home Value in this Area
Purchase History
| Date | Buyer | Sale Price | Title Company |
|---|---|---|---|
| Edwards Kenneth D | -- | None Available | |
| Edwards Kenneth D | $183,000 | -- | |
| Edwards Kenneth D | $183,000 | -- | |
| Mcdonald Jimmy | $10,000 | -- | |
| Tarter Howard D | $13,500 | -- |
Source: Public Records
Mortgage History
| Date | Status | Borrower | Loan Amount |
|---|---|---|---|
| Open | Tarter Howard D | $63,500 | |
| Closed | Tarter Howard D | $85,000 | |
| Closed | Tarter Howard D | $85,000 |
Source: Public Records
Tax History Compared to Growth
Tax History
| Year | Tax Paid | Tax Assessment Tax Assessment Total Assessment is a certain percentage of the fair market value that is determined by local assessors to be the total taxable value of land and additions on the property. | Land | Improvement |
|---|---|---|---|---|
| 2025 | -- | $75,500 | $7,500 | $68,000 |
| 2024 | -- | $75,500 | $7,500 | $68,000 |
| 2023 | $0 | $75,500 | $0 | $0 |
| 2022 | $857 | $75,500 | $7,500 | $68,000 |
| 2021 | $828 | $52,925 | $7,500 | $45,425 |
| 2020 | $828 | $52,925 | $7,500 | $45,425 |
| 2019 | $811 | $52,925 | $7,500 | $45,425 |
| 2018 | $772 | $51,825 | $7,500 | $44,325 |
| 2017 | $772 | $49,325 | $5,000 | $44,325 |
| 2016 | $746 | $48,825 | $5,000 | $43,825 |
| 2015 | $731 | $48,825 | $5,000 | $43,825 |
| 2014 | $731 | $48,831 | $0 | $0 |
Source: Public Records
Map
Nearby Homes
- 184 Trentwood Dr
- 186 Trentwood Dr
- 220 Catoosa Blvd
- 44 Walden Ridge Terrace
- 31 Oakcrest Ct
- 17 Pineridge Ct
- 131 Rotherham Dr
- 13 Oakcrest Cir
- 170 Trentwood Dr
- 139 Rotherham Dr
- 141 Rotherham Dr
- 145 Trentwood Dr
- 153 Trentwood Dr
- 120 Bent Oak Terrace
- 12 Walden Ridge Cir
- 179 Pineridge Loop
- 119 Pineridge Loop
- 152 Stonewood Dr
- 121 Pineridge Loop
- 175 Pineridge Loop
- 113 Trentwood Dr
- 117 Trentwood Dr
- 15 Doyle Ct
- 109 Trentwood Dr
- 17 Doyle Ct
- 114 Trentwood Dr
- 112 Trentwood Dr
- 116 Trentwood Dr
- 107 Trentwood Dr
- 110 Trentwood Dr
- 12 Doyle Ct
- 10 Doyle Ct
- 118 Trentwood Dr
- 14 Doyle Ct
- 19 Doyle Ct
- 119 Trentwood Dr
- 16 Doyle Ct
- 105 Trentwood Dr
- 11 Feldwood Ct
- 11 Feldwood Dr