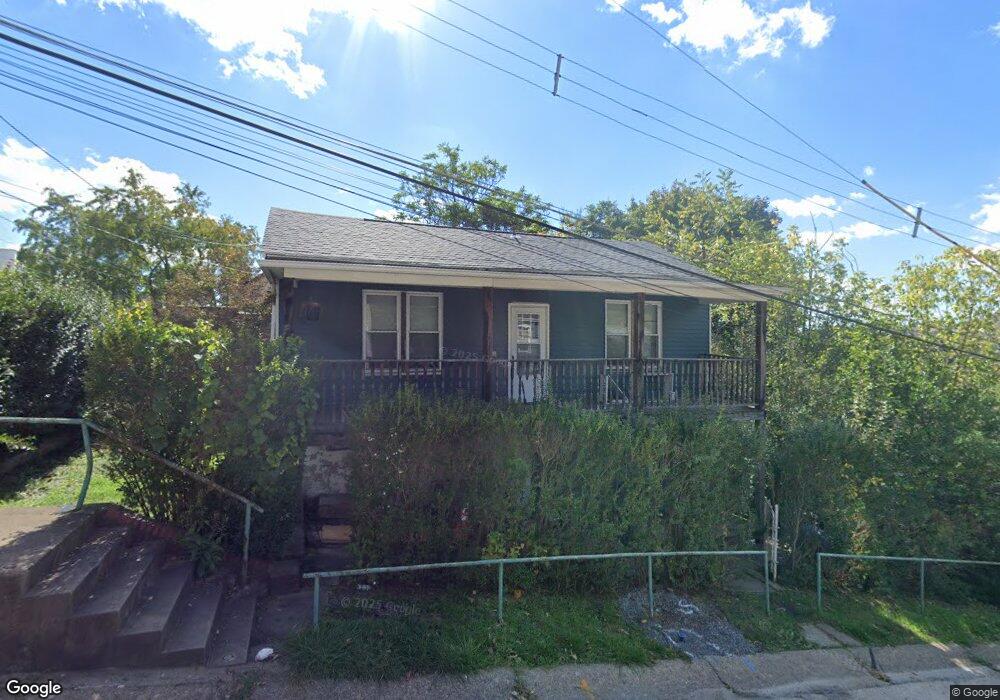
115 Tuscola St Pittsburgh, PA 15211
Mount Washington NeighborhoodEstimated Value: $83,913 - $187,000
1
Bed
1
Bath
576
Sq Ft
$231/Sq Ft
Est. Value
About This Home
This home is located at 115 Tuscola St, Pittsburgh, PA 15211 and is currently estimated at $132,978, approximately $230 per square foot. 115 Tuscola St is a home with nearby schools including Pittsburgh Whittier K-5, South Hills Middle School, and Pittsburgh Brashear High School.
Ownership History
Date
Name
Owned For
Owner Type
Purchase Details
Closed on
Jun 28, 2018
Sold by
Berardelli Paul A
Bought by
Mccullough David M
Current Estimated Value
Home Financials for this Owner
Home Financials are based on the most recent Mortgage that was taken out on this home.
Original Mortgage
$65,000
Outstanding Balance
$56,457
Interest Rate
4.6%
Mortgage Type
New Conventional
Estimated Equity
$76,521
Purchase Details
Closed on
Dec 16, 1999
Sold by
Wible William A and Wible Loretta J
Bought by
Berardelli Paul A and Berardelli Brenda L
Create a Home Valuation Report for This Property
The Home Valuation Report is an in-depth analysis detailing your home's value as well as a comparison with similar homes in the area
Home Values in the Area
Average Home Value in this Area
Purchase History
| Date | Buyer | Sale Price | Title Company |
|---|---|---|---|
| Mccullough David M | $65,000 | Ta Closing Network Llc | |
| Berardelli Paul A | $20,000 | Commonwealth Land Title Ins |
Source: Public Records
Mortgage History
| Date | Status | Borrower | Loan Amount |
|---|---|---|---|
| Open | Mccullough David M | $65,000 |
Source: Public Records
Tax History Compared to Growth
Tax History
| Year | Tax Paid | Tax Assessment Tax Assessment Total Assessment is a certain percentage of the fair market value that is determined by local assessors to be the total taxable value of land and additions on the property. | Land | Improvement |
|---|---|---|---|---|
| 2025 | $638 | $27,700 | $13,400 | $14,300 |
| 2024 | $638 | $27,700 | $13,400 | $14,300 |
| 2023 | $638 | $27,700 | $13,400 | $14,300 |
| 2022 | $630 | $27,700 | $13,400 | $14,300 |
| 2021 | $630 | $27,700 | $13,400 | $14,300 |
| 2020 | $627 | $27,700 | $13,400 | $14,300 |
| 2019 | $627 | $27,700 | $13,400 | $14,300 |
| 2018 | $503 | $27,700 | $13,400 | $14,300 |
| 2017 | $627 | $27,700 | $13,400 | $14,300 |
| 2016 | $131 | $27,700 | $13,400 | $14,300 |
| 2015 | $131 | $27,700 | $13,400 | $14,300 |
| 2014 | $613 | $27,700 | $13,400 | $14,300 |
Source: Public Records
Map
Nearby Homes