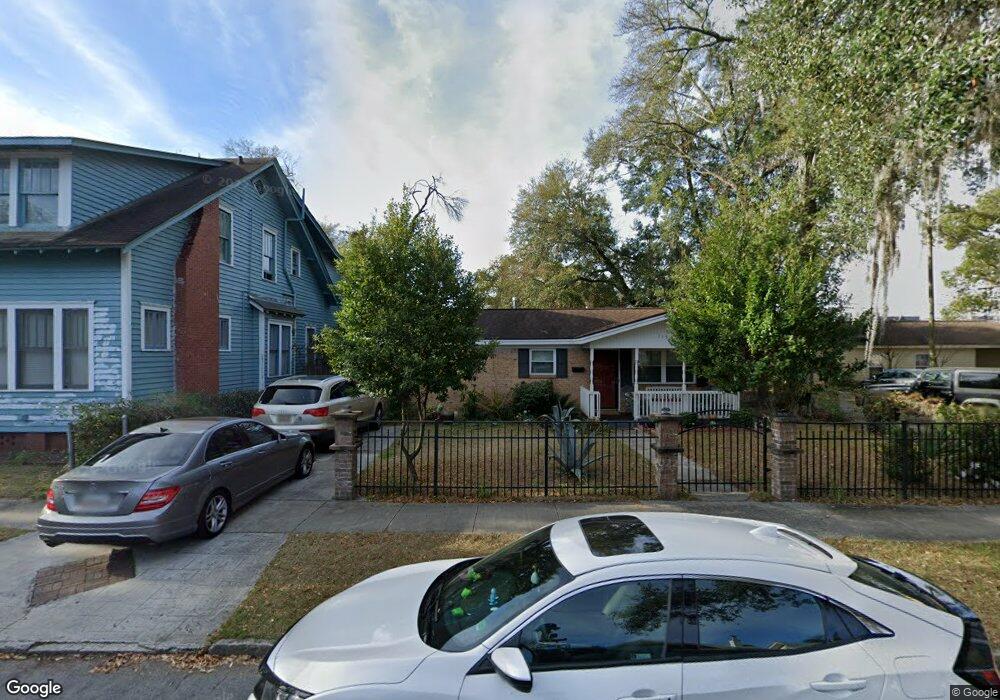
115 W 41st St Savannah, GA 31401
Metropolitan NeighborhoodEstimated Value: $226,778 - $367,000
3
Beds
1
Bath
912
Sq Ft
$294/Sq Ft
Est. Value
About This Home
This home is located at 115 W 41st St, Savannah, GA 31401 and is currently estimated at $268,445, approximately $294 per square foot. 115 W 41st St is a home located in Chatham County with nearby schools including Derenne Middle School and Beach High School.
Ownership History
Date
Name
Owned For
Owner Type
Purchase Details
Closed on
Feb 17, 2016
Sold by
Kennedy Martha Ann
Bought by
Kennedy Housing Llc
Current Estimated Value
Purchase Details
Closed on
Jul 6, 2010
Sold by
Us Bank
Bought by
Kennedy Martha Ann and Kennedy Dale T
Home Financials for this Owner
Home Financials are based on the most recent Mortgage that was taken out on this home.
Original Mortgage
$30,000
Interest Rate
4.73%
Mortgage Type
New Conventional
Purchase Details
Closed on
Jun 25, 2010
Sold by
Ocwen Loan Servicing Llc
Bought by
Us Bank Na Trustee
Home Financials for this Owner
Home Financials are based on the most recent Mortgage that was taken out on this home.
Original Mortgage
$30,000
Interest Rate
4.73%
Mortgage Type
New Conventional
Purchase Details
Closed on
Apr 7, 2009
Sold by
Bing Ronnie
Bought by
Us Bank Na
Purchase Details
Closed on
Apr 26, 2006
Sold by
Not Provided
Bought by
Kennedy Martha Ann and Kennedy Dale T
Create a Home Valuation Report for This Property
The Home Valuation Report is an in-depth analysis detailing your home's value as well as a comparison with similar homes in the area
Home Values in the Area
Average Home Value in this Area
Purchase History
| Date | Buyer | Sale Price | Title Company |
|---|---|---|---|
| Kennedy Housing Llc | -- | -- | |
| Kennedy Martha Ann | $39,900 | -- | |
| Us Bank Na Trustee | -- | -- | |
| Us Bank Na | $52,021 | -- | |
| Kennedy Martha Ann | -- | -- |
Source: Public Records
Mortgage History
| Date | Status | Borrower | Loan Amount |
|---|---|---|---|
| Previous Owner | Kennedy Martha Ann | $30,000 |
Source: Public Records
Tax History Compared to Growth
Tax History
| Year | Tax Paid | Tax Assessment Tax Assessment Total Assessment is a certain percentage of the fair market value that is determined by local assessors to be the total taxable value of land and additions on the property. | Land | Improvement |
|---|---|---|---|---|
| 2025 | $2,620 | $88,520 | $50,000 | $38,520 |
| 2024 | $2,620 | $86,680 | $50,000 | $36,680 |
| 2023 | $770 | $82,760 | $50,000 | $32,760 |
| 2022 | $1,182 | $65,640 | $36,000 | $29,640 |
| 2021 | $1,803 | $38,360 | $10,000 | $28,360 |
| 2020 | $919 | $29,120 | $10,000 | $19,120 |
| 2019 | $1,294 | $29,120 | $10,000 | $19,120 |
| 2018 | $778 | $24,640 | $10,000 | $14,640 |
| 2017 | $891 | $30,400 | $15,120 | $15,280 |
| 2016 | $773 | $26,480 | $15,120 | $11,360 |
| 2015 | $1,076 | $25,800 | $15,120 | $10,680 |
| 2014 | $1,424 | $26,120 | $0 | $0 |
Source: Public Records
Map
Nearby Homes
- 216 W 43rd St
- 2406 De Soto Ave Unit B
- 310 W 42nd St
- 221 W 39th St
- 0 E Victory Dr Unit SA342445
- 303 W 39th St
- 420 W 42nd St
- 218 W 38th St
- 302 W 38th St
- 501 W 42nd St
- 306 W 38th St
- 116 Pearl St
- 118 Pearl St
- 503 W 42nd St
- 312 W 38th St
- 111 E 39th St
- 102 E 38th St
- 17 E 37th St Unit 11
- 17 E 37th St Unit 3
- 17 E 37th St Unit 12
- 109 W 41st St
- 123 W 41st St Unit B
- 123 W 41st St
- 123 W 41st St Unit D
- 123 W 41st St Unit A
- 123 W 41st St Unit C
- 105 W 41st St
- 114 W 42nd St
- 114 W 41st St
- 108 W 42nd St
- 110 W 41st St
- 101 W 41st St
- 120 W 41st St
- 104 W 41st St
- 118 W 41st St
- 102 W 41st St
- 2503 Barnard St
- 2501 Barnard St
- 202 W 42nd St
- 115 W 42nd St