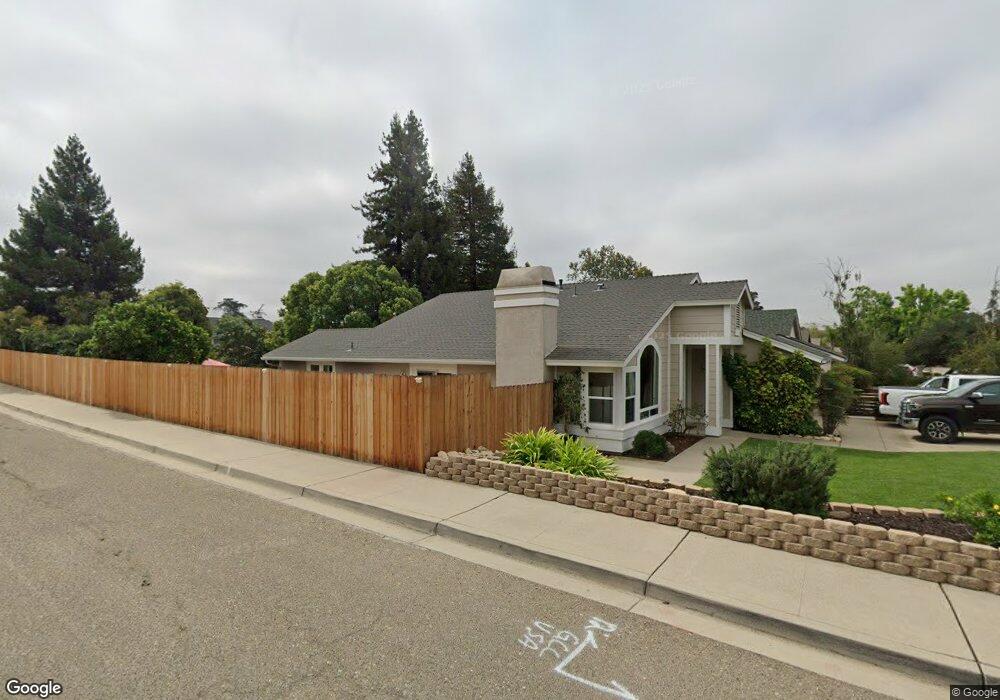
115 W Chestnut St Nipomo, CA 93444
Estimated Value: $707,000 - $799,000
3
Beds
2
Baths
1,715
Sq Ft
$438/Sq Ft
Est. Value
About This Home
This home is located at 115 W Chestnut St, Nipomo, CA 93444 and is currently estimated at $750,807, approximately $437 per square foot. 115 W Chestnut St is a home located in San Luis Obispo County with nearby schools including Nipomo Elementary School, Mesa Middle School, and Nipomo High School.
Ownership History
Date
Name
Owned For
Owner Type
Purchase Details
Closed on
Oct 8, 2021
Sold by
Runels Lance Alan and Runels Andrea Marie
Bought by
Runels Lance Alan and Runels Andrea Marie
Current Estimated Value
Purchase Details
Closed on
Jun 26, 1995
Sold by
Mallory Phillip James and Mallory Nicola Mae
Bought by
Runels Lance Alan and Runels Andrea Marie
Home Financials for this Owner
Home Financials are based on the most recent Mortgage that was taken out on this home.
Original Mortgage
$148,200
Interest Rate
7.59%
Create a Home Valuation Report for This Property
The Home Valuation Report is an in-depth analysis detailing your home's value as well as a comparison with similar homes in the area
Home Values in the Area
Average Home Value in this Area
Purchase History
| Date | Buyer | Sale Price | Title Company |
|---|---|---|---|
| Runels Lance Alan | -- | None Available | |
| Runels Lance Alan | -- | None Available | |
| Runels Lance Alan | $156,000 | Chicago Title Co |
Source: Public Records
Mortgage History
| Date | Status | Borrower | Loan Amount |
|---|---|---|---|
| Closed | Runels Lance Alan | $148,200 |
Source: Public Records
Tax History Compared to Growth
Tax History
| Year | Tax Paid | Tax Assessment Tax Assessment Total Assessment is a certain percentage of the fair market value that is determined by local assessors to be the total taxable value of land and additions on the property. | Land | Improvement |
|---|---|---|---|---|
| 2025 | $2,592 | $259,124 | $116,271 | $142,853 |
| 2024 | $2,561 | $254,044 | $113,992 | $140,052 |
| 2023 | $2,561 | $249,063 | $111,757 | $137,306 |
| 2022 | $2,521 | $244,180 | $109,566 | $134,614 |
| 2021 | $2,515 | $239,393 | $107,418 | $131,975 |
| 2020 | $2,485 | $236,939 | $106,317 | $130,622 |
| 2019 | $2,468 | $232,294 | $104,233 | $128,061 |
| 2018 | $2,437 | $227,740 | $102,190 | $125,550 |
| 2017 | $2,390 | $223,276 | $100,187 | $123,089 |
| 2016 | $2,253 | $218,899 | $98,223 | $120,676 |
| 2015 | $2,294 | $215,612 | $96,748 | $118,864 |
| 2014 | $2,209 | $211,389 | $94,853 | $116,536 |
Source: Public Records
Map
Nearby Homes
- 1 W Branch St
- 0 S Burton St
- 150 E Chestnut St
- 90111003 W Price St
- 400 N Oakglen Ave
- 189 E Tefft St
- 412 N Mallagh St
- 160 San Antonio Ln
- 449 W Tefft St Unit 23
- 449 W Tefft St Unit 13
- 285 E Tefft St
- 525 Grande Ave Unit D
- 255 Encino Ln
- 680 Hill St
- 368 Avenida de Amigos
- Mesa Plan at Hill Street Terraces - Hill Street Series
- Pacific Plan at Hill Street Terraces - Hill Street Series
- Monarch Plan at Hill Street Terraces - Hill Street Series
- Rancho Plan at Hill Street Terraces - Hill Street Series
- Dana Plan at Hill Street Terraces - Hill Street Series
- 117 W Chestnut St
- 137 W Chestnut St
- 111 W Chestnut St
- 116 W Branch St
- 139 W Chestnut St
- 118 W Branch St
- 134 W Branch St
- 112 W Branch St
- 116 W Chestnut St
- 124 W Chestnut St
- 161 W Chestnut St
- 146 W Branch St
- 132 W Chestnut St
- 90131001 W Branch St
- 151 W Branch St
- 211 W Branch St
- 111 W Branch St
- 210 N Burton St
- 105 W Chestnut St