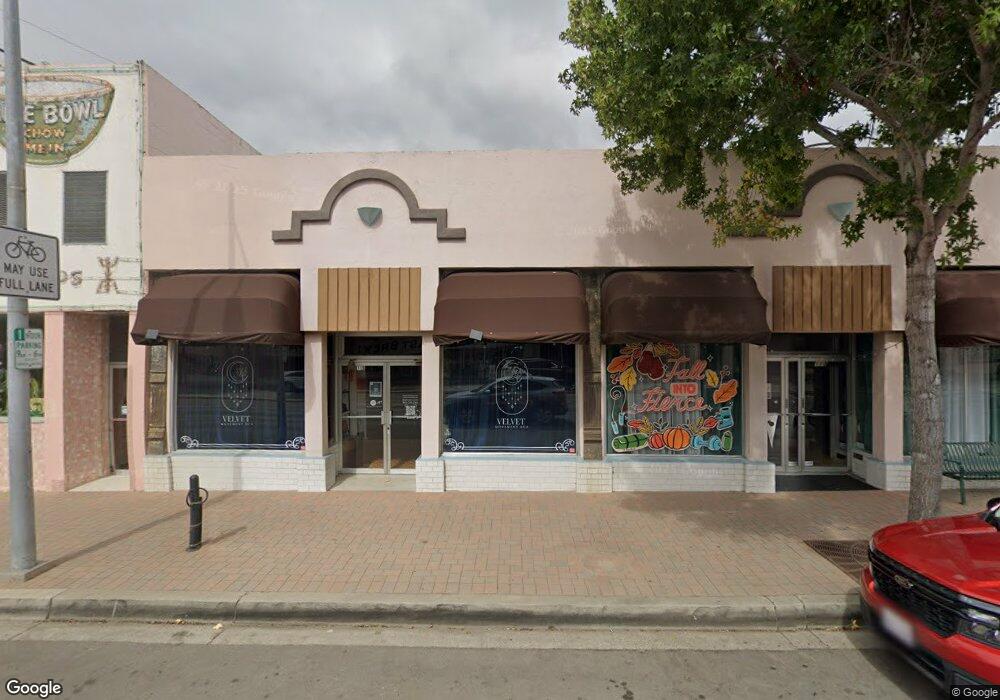
115 W Ocean Ave Lompoc, CA 93436
Studio
--
Bath
3,100
Sq Ft
3,485
Sq Ft Lot
About This Home
This home is located at 115 W Ocean Ave, Lompoc, CA 93436. 115 W Ocean Ave is a home located in Santa Barbara County with nearby schools including Arthur Hapgood Elementary School, Lompoc Valley Middle School, and Lompoc High School.
Ownership History
Date
Name
Owned For
Owner Type
Purchase Details
Closed on
Mar 7, 2024
Sold by
Julio Cesar Barrera 2009 Revocable Trust
Bought by
Lp & Sm Investments Llc
Purchase Details
Closed on
Apr 20, 2022
Sold by
Leblanc Brandon
Bought by
Julio Barrera 2009 Revocable Trust and Barrera
Purchase Details
Closed on
May 20, 2014
Sold by
Buentiempo Tracey R
Bought by
Leblanc Brandon
Purchase Details
Closed on
Apr 23, 2010
Sold by
Leblanc Philip Raymond
Bought by
Leblanc Philip Raymond
Purchase Details
Closed on
Feb 6, 1996
Sold by
Lombardie Louis and Lombardie Jeanette
Bought by
Leblanc Philip
Home Financials for this Owner
Home Financials are based on the most recent Mortgage that was taken out on this home.
Original Mortgage
$70,000
Interest Rate
6.98%
Create a Home Valuation Report for This Property
The Home Valuation Report is an in-depth analysis detailing your home's value as well as a comparison with similar homes in the area
Home Values in the Area
Average Home Value in this Area
Purchase History
| Date | Buyer | Sale Price | Title Company |
|---|---|---|---|
| Lp & Sm Investments Llc | -- | None Listed On Document | |
| Julio Barrera 2009 Revocable Trust | $380,000 | First American Title | |
| Leblanc Brandon | -- | None Available | |
| Leblanc Philip Raymond | -- | None Available | |
| Leblanc Philip | $95,000 | Chicago Title Co |
Source: Public Records
Mortgage History
| Date | Status | Borrower | Loan Amount |
|---|---|---|---|
| Previous Owner | Leblanc Philip | $70,000 |
Source: Public Records
Tax History
| Year | Tax Paid | Tax Assessment Tax Assessment Total Assessment is a certain percentage of the fair market value that is determined by local assessors to be the total taxable value of land and additions on the property. | Land | Improvement |
|---|---|---|---|---|
| 2025 | $2,244 | $201,629 | $53,060 | $148,569 |
| 2023 | $2,244 | $193,800 | $51,000 | $142,800 |
| 2022 | $1,690 | $144,387 | $57,754 | $86,633 |
| 2021 | $1,706 | $141,557 | $56,622 | $84,935 |
| 2020 | $1,688 | $140,107 | $56,042 | $84,065 |
| 2019 | $1,659 | $137,361 | $54,944 | $82,417 |
| 2018 | $1,633 | $134,668 | $53,867 | $80,801 |
| 2017 | $1,603 | $132,028 | $52,811 | $79,217 |
| 2016 | $1,574 | $129,440 | $51,776 | $77,664 |
| 2014 | $1,532 | $124,297 | $45,136 | $79,161 |
Source: Public Records
Map
Nearby Homes
Your Personal Tour Guide
Ask me questions while you tour the home.