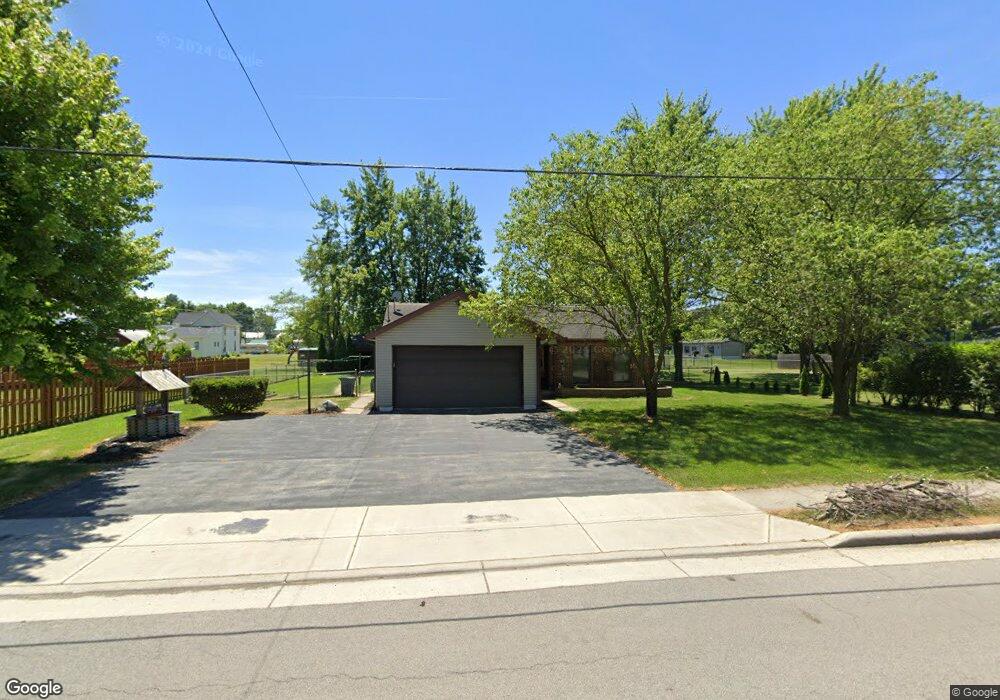
115 W Oliver St Mc Comb, OH 45858
McComb NeighborhoodEstimated Value: $167,000 - $188,462
3
Beds
2
Baths
1,153
Sq Ft
$157/Sq Ft
Est. Value
About This Home
This home is located at 115 W Oliver St, Mc Comb, OH 45858 and is currently estimated at $180,616, approximately $156 per square foot. 115 W Oliver St is a home with nearby schools including McComb Elementary School, McComb Middle School, and Mccomb Local High School.
Ownership History
Date
Name
Owned For
Owner Type
Purchase Details
Closed on
Sep 26, 2011
Sold by
Womack James R and Womack Sandra L
Bought by
Livin Womack James R and Livin James R Womack Revocable
Current Estimated Value
Purchase Details
Closed on
Mar 15, 1991
Bought by
Womack James R and Womack Sandra L
Create a Home Valuation Report for This Property
The Home Valuation Report is an in-depth analysis detailing your home's value as well as a comparison with similar homes in the area
Home Values in the Area
Average Home Value in this Area
Purchase History
| Date | Buyer | Sale Price | Title Company |
|---|---|---|---|
| Livin Womack James R | -- | Attorney | |
| Womack James R | $64,000 | -- |
Source: Public Records
Tax History Compared to Growth
Tax History
| Year | Tax Paid | Tax Assessment Tax Assessment Total Assessment is a certain percentage of the fair market value that is determined by local assessors to be the total taxable value of land and additions on the property. | Land | Improvement |
|---|---|---|---|---|
| 2024 | $1,981 | $58,180 | $5,650 | $52,530 |
| 2023 | $1,969 | $58,180 | $5,650 | $52,530 |
| 2022 | $2,332 | $57,980 | $5,650 | $52,330 |
| 2021 | $2,273 | $50,960 | $5,130 | $45,830 |
| 2020 | $1,989 | $50,960 | $5,130 | $45,830 |
| 2019 | $2,178 | $50,960 | $5,130 | $45,830 |
| 2018 | $1,844 | $45,130 | $4,460 | $40,670 |
| 2017 | $1,855 | $45,130 | $4,460 | $40,670 |
| 2016 | $1,775 | $45,130 | $4,460 | $40,670 |
| 2015 | $1,437 | $36,870 | $4,760 | $32,110 |
| 2014 | $1,452 | $36,870 | $4,760 | $32,110 |
| 2012 | $1,489 | $43,450 | $4,760 | $38,690 |
Source: Public Records
Map
Nearby Homes
- 207 N Todd St
- 223 Cherry St
- 236 E Perrin Ave
- 0 Andrew Dr
- 0 Joshua Rd Unit 51 6126475
- 3699 State Route 613
- 4134 County Road 203
- 5330 State Route 186
- 687 State Route 235
- 6659 Scenic View Dr
- 4674 Township Road 117
- 4516 W US Route 224
- 358 State Route 613
- 4258 County Road 140
- 7780 Township Road 89
- 9991 State Route 613
- 0 Rock Candy Rd Unit Lot 172 206819
- 0 Rock Candy Rd
- 0 Rock Candy Rd Or Bushwillow Dr Unit 206820
- 0 Bearcat Way Or Rock Candy Rd Unit 206810
- 123 W Oliver St
- 214 N Todd St
- 127 W Oliver St
- 116 W Perrin Ave
- 104 W Oliver St
- 139 W Oliver St
- 304 N Todd St
- 124 W Perrin Ave
- 141 W Oliver St
- 314 N Todd St
- 104 E Oliver St
- 219 N Todd St
- 215 N Todd St
- 136 W Oliver St
- 318 N Todd St
- 143 W Oliver St
- 140 W Oliver St
- 120 W Cooper St
- 116 E Oliver St
- 308 N Liberty St