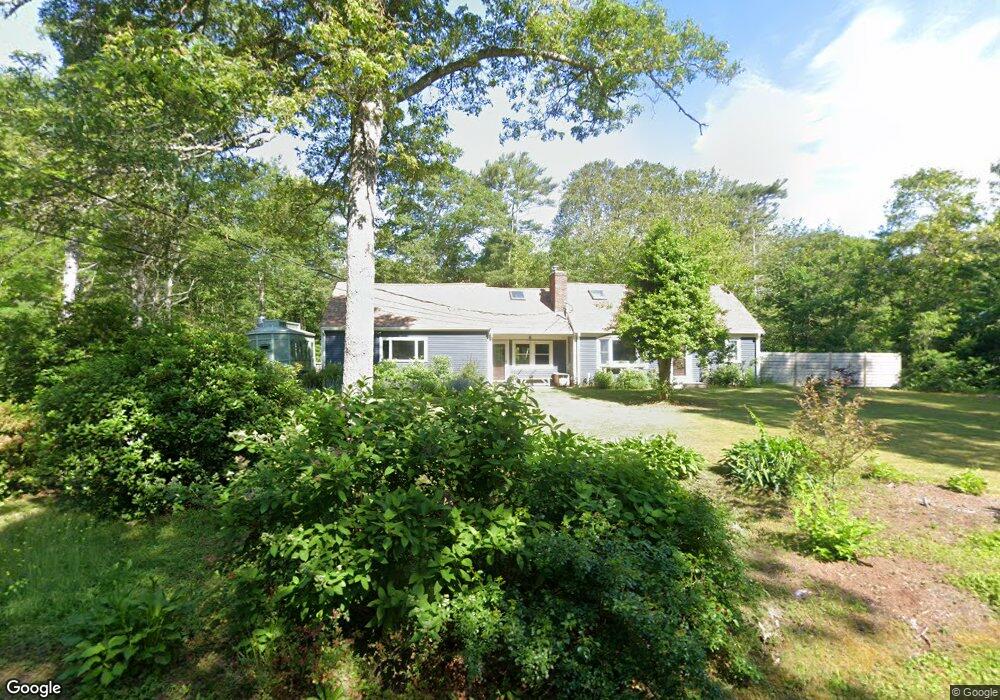
115 Walnut St Marstons Mills, MA 02648
Marstons Mills NeighborhoodEstimated Value: $704,000 - $757,000
3
Beds
2
Baths
2,353
Sq Ft
$310/Sq Ft
Est. Value
About This Home
This home is located at 115 Walnut St, Marstons Mills, MA 02648 and is currently estimated at $730,488, approximately $310 per square foot. 115 Walnut St is a home located in Barnstable County with nearby schools including West Villages Elementary School, Barnstable United Elementary School, and Barnstable Intermediate School.
Ownership History
Date
Name
Owned For
Owner Type
Purchase Details
Closed on
Dec 20, 2018
Sold by
Greer Jean
Bought by
Greer Richard T and Martinez Stephanie A
Current Estimated Value
Home Financials for this Owner
Home Financials are based on the most recent Mortgage that was taken out on this home.
Original Mortgage
$310,000
Outstanding Balance
$273,134
Interest Rate
4.9%
Mortgage Type
New Conventional
Estimated Equity
$457,354
Purchase Details
Closed on
Apr 22, 2016
Sold by
Greer Richard
Bought by
Greer Jean
Create a Home Valuation Report for This Property
The Home Valuation Report is an in-depth analysis detailing your home's value as well as a comparison with similar homes in the area
Home Values in the Area
Average Home Value in this Area
Purchase History
| Date | Buyer | Sale Price | Title Company |
|---|---|---|---|
| Greer Richard T | $417,000 | -- | |
| Greer Richard T | $417,000 | -- | |
| Greer Jean | -- | -- | |
| Greer Jean | -- | -- |
Source: Public Records
Mortgage History
| Date | Status | Borrower | Loan Amount |
|---|---|---|---|
| Open | Greer Richard T | $310,000 | |
| Closed | Greer Richard T | $310,000 |
Source: Public Records
Tax History Compared to Growth
Tax History
| Year | Tax Paid | Tax Assessment Tax Assessment Total Assessment is a certain percentage of the fair market value that is determined by local assessors to be the total taxable value of land and additions on the property. | Land | Improvement |
|---|---|---|---|---|
| 2025 | $5,438 | $672,200 | $168,600 | $503,600 |
| 2024 | $5,041 | $645,400 | $168,600 | $476,800 |
| 2023 | $4,805 | $576,100 | $153,200 | $422,900 |
| 2022 | $4,558 | $472,800 | $113,500 | $359,300 |
| 2021 | $4,445 | $423,700 | $113,500 | $310,200 |
| 2020 | $4,451 | $406,100 | $113,500 | $292,600 |
| 2019 | $4,213 | $373,500 | $113,500 | $260,000 |
| 2018 | $3,885 | $346,300 | $119,500 | $226,800 |
| 2017 | $3,642 | $338,500 | $119,500 | $219,000 |
| 2016 | $3,659 | $335,700 | $116,700 | $219,000 |
| 2015 | $3,723 | $343,100 | $118,300 | $224,800 |
Source: Public Records
Map
Nearby Homes
- 1028 Old Falmouth Rd
- 1044 Old Falmouth Rd
- 87 Foxglove Rd
- 88 Joe Thompson Rd
- 74 Saddler Ln
- 80 Saddler Ln
- 315 Prince Hinckley Rd
- 21 Shannon Way
- 50 Currycomb Cir
- 40 Appaloosa Way
- 158 Lakeside Dr
- 900 Old Stage Rd
- 62 Three Ponds Dr
- 7 Ebenezer
- 128 Lakeside Dr
- 17 Ebenezer Rd
- 5 Huckleberry Ln
- 205 James Otis Rd
- 296 Buckskin Path