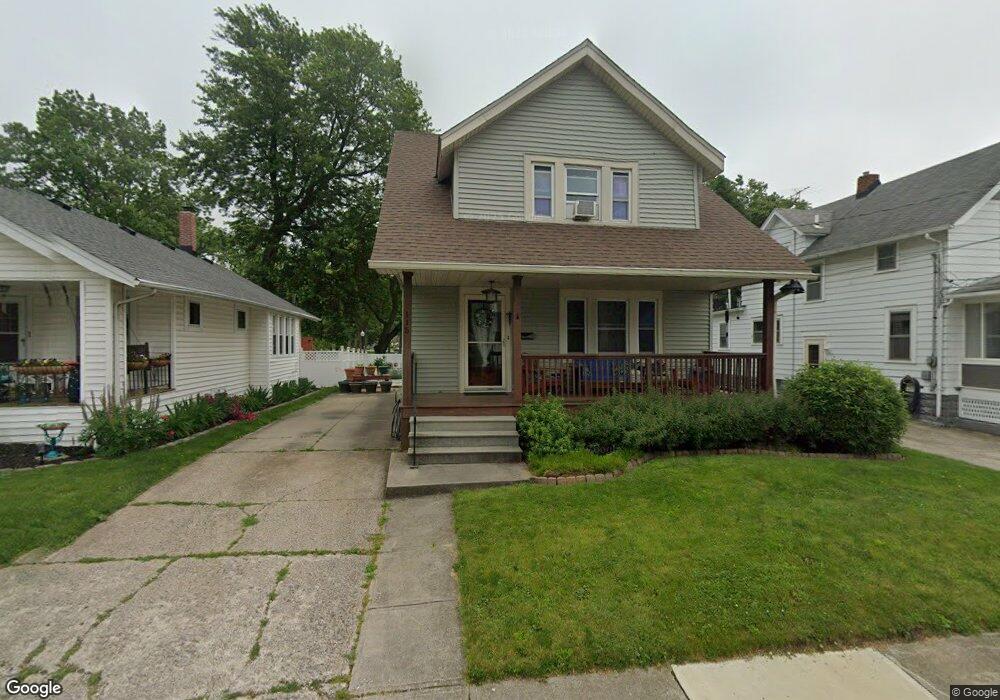
115 Waverly Place Lorain, OH 44052
Estimated Value: $168,474 - $226,000
3
Beds
2
Baths
1,259
Sq Ft
$155/Sq Ft
Est. Value
About This Home
This home is located at 115 Waverly Place, Lorain, OH 44052 and is currently estimated at $195,369, approximately $155 per square foot. 115 Waverly Place is a home located in Lorain County with nearby schools including Admiral King Elementary School, Gen. Johnnie Wilson Middle School, and Lorain High School.
Ownership History
Date
Name
Owned For
Owner Type
Purchase Details
Closed on
Jun 29, 2020
Sold by
Ewers Mary C
Bought by
Ewers Joyner Mary and Joyner Brian
Current Estimated Value
Home Financials for this Owner
Home Financials are based on the most recent Mortgage that was taken out on this home.
Original Mortgage
$84,000
Outstanding Balance
$74,624
Interest Rate
3.2%
Mortgage Type
New Conventional
Estimated Equity
$120,745
Purchase Details
Closed on
Jul 30, 2014
Sold by
Ewers William R and Ewers Martina
Bought by
Ewers Mary C
Home Financials for this Owner
Home Financials are based on the most recent Mortgage that was taken out on this home.
Original Mortgage
$87,400
Interest Rate
4.19%
Mortgage Type
Future Advance Clause Open End Mortgage
Purchase Details
Closed on
Mar 20, 2007
Sold by
Ewers Raymond J
Bought by
Ewers William R and Ewers Martina
Purchase Details
Closed on
Jan 12, 2006
Sold by
Estate Of Ray A Ewers
Bought by
Estate Of Roselia A Ewers
Create a Home Valuation Report for This Property
The Home Valuation Report is an in-depth analysis detailing your home's value as well as a comparison with similar homes in the area
Home Values in the Area
Average Home Value in this Area
Purchase History
| Date | Buyer | Sale Price | Title Company |
|---|---|---|---|
| Ewers Joyner Mary | -- | Ally Title Agency Llc | |
| Ewers Mary C | $94,000 | None Available | |
| Ewers William R | $51,600 | Attorney | |
| Estate Of Roselia A Ewers | -- | None Available |
Source: Public Records
Mortgage History
| Date | Status | Borrower | Loan Amount |
|---|---|---|---|
| Open | Ewers Joyner Mary | $84,000 | |
| Closed | Ewers Mary C | $87,400 |
Source: Public Records
Tax History Compared to Growth
Tax History
| Year | Tax Paid | Tax Assessment Tax Assessment Total Assessment is a certain percentage of the fair market value that is determined by local assessors to be the total taxable value of land and additions on the property. | Land | Improvement |
|---|---|---|---|---|
| 2024 | $2,362 | $57,285 | $17,581 | $39,704 |
| 2023 | $1,827 | $35,476 | $10,633 | $24,843 |
| 2022 | $1,811 | $35,476 | $10,633 | $24,843 |
| 2021 | $1,811 | $35,476 | $10,633 | $24,843 |
| 2020 | $1,745 | $29,690 | $8,900 | $20,790 |
| 2019 | $1,735 | $29,690 | $8,900 | $20,790 |
| 2018 | $1,736 | $29,690 | $8,900 | $20,790 |
| 2017 | $2,049 | $33,050 | $9,540 | $23,510 |
| 2016 | $2,033 | $33,050 | $9,540 | $23,510 |
| 2015 | $1,918 | $33,050 | $9,540 | $23,510 |
| 2014 | $1,967 | $33,050 | $9,540 | $23,510 |
| 2013 | $1,952 | $33,050 | $9,540 | $23,510 |
Source: Public Records
Map
Nearby Homes
- 119 Waverly Place
- 2228 Harborview Blvd
- 215 N Leavitt Rd
- 1304 Lakeview Ave
- 1725 W 12th St
- VL#2 Arianna Ave
- VL#1 Arianna Ave
- 1336 Lakeview Ave
- 1524 Lakeview Ave
- 858 Allison Ave
- 0 W 19th Ct
- 1357 W 2nd St
- 1348 W Erie Ave
- 842 Brownell Ave
- 1727 W 19th St
- 1504 W 19th St
- 1836 W 21st St
- 1311 W Erie Ave
- 1810 W 21st St
- 1211 W 10th St
- 113 Waverly Place
- 109 Waverly Place
- 123 Waverly Place
- 116 Waverly Place
- 112 Waverly Place
- 120 Waverly Place
- 108 Waverly Place
- 124 Waverly Place
- 105 Waverly Place
- 104 Waverly Place
- 2110 W Erie Ave
- 2112 W Erie Ave
- 128 Waverly Place
- 100 Waverly Place
- 2116 Harborview Blvd
- 2125 Harborview Blvd
- 2122 Harborview Blvd
- 206 Waverly Place
- 2124 W Erie Ave
- 2126 Harborview Blvd