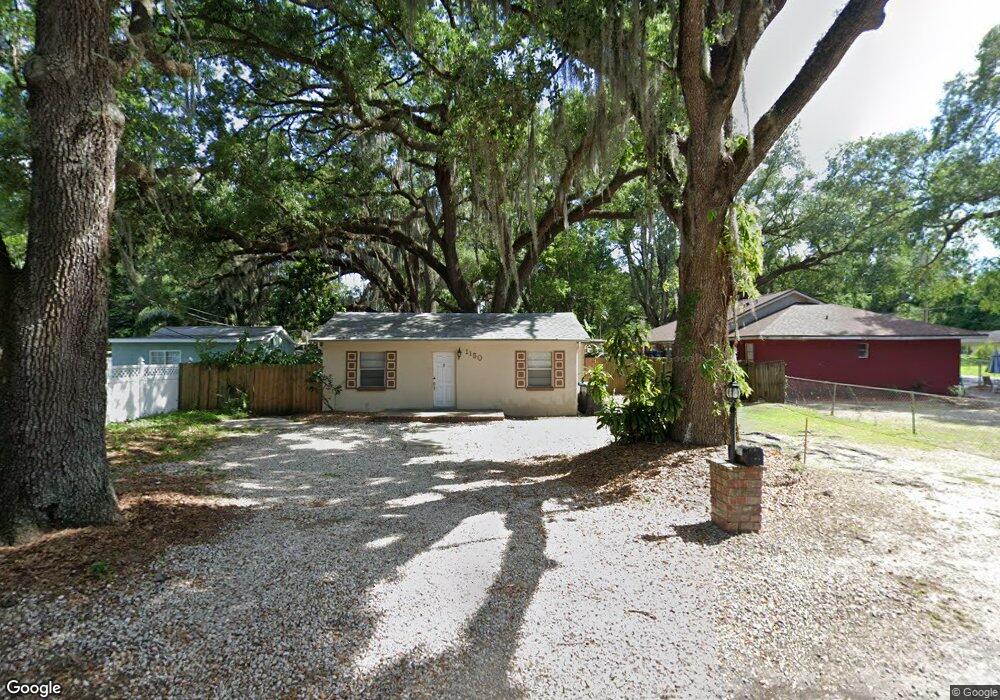
1150 35th St Orlando, FL 32805
Holden Heights NeighborhoodEstimated Value: $203,000 - $224,000
2
Beds
1
Bath
1,045
Sq Ft
$204/Sq Ft
Est. Value
About This Home
This home is located at 1150 35th St, Orlando, FL 32805 and is currently estimated at $213,170, approximately $203 per square foot. 1150 35th St is a home located in Orange County with nearby schools including Pineloch Elementary School, Memorial Middle School, and Oak Ridge High School.
Ownership History
Date
Name
Owned For
Owner Type
Purchase Details
Closed on
Jan 28, 2019
Sold by
Willis Kimberly A and 2205 Continental Blvd Trust
Bought by
Roby Blake and 1150 35Th Street Trust
Current Estimated Value
Purchase Details
Closed on
Nov 17, 2010
Sold by
Hettler G
Bought by
Roby Blake and 1150 35Th Street Trust
Purchase Details
Closed on
Nov 16, 2010
Sold by
Hettler G
Bought by
Willis Kimberly A and 1150 35Th Street Trust
Purchase Details
Closed on
May 24, 2000
Sold by
Acks Peter J and Acks Gabriele H
Bought by
Hettler G
Purchase Details
Closed on
Aug 21, 1995
Sold by
Federal Home Loan Mortgage Corporation
Bought by
Acks Peter J and Acks Gabriele H
Home Financials for this Owner
Home Financials are based on the most recent Mortgage that was taken out on this home.
Original Mortgage
$26,350
Interest Rate
7.42%
Purchase Details
Closed on
Jul 20, 1995
Sold by
Clerk Circuit Court
Bought by
Federal Home Loan Mortgage Corporation
Home Financials for this Owner
Home Financials are based on the most recent Mortgage that was taken out on this home.
Original Mortgage
$26,350
Interest Rate
7.42%
Create a Home Valuation Report for This Property
The Home Valuation Report is an in-depth analysis detailing your home's value as well as a comparison with similar homes in the area
Home Values in the Area
Average Home Value in this Area
Purchase History
| Date | Buyer | Sale Price | Title Company |
|---|---|---|---|
| Roby Blake | -- | None Available | |
| Roby Blake | -- | None Available | |
| Willis Kimberly A | -- | None Available | |
| Hettler G | -- | -- | |
| Acks Peter J | $31,000 | -- | |
| Federal Home Loan Mortgage Corporation | -- | -- |
Source: Public Records
Mortgage History
| Date | Status | Borrower | Loan Amount |
|---|---|---|---|
| Previous Owner | Acks Peter J | $26,350 |
Source: Public Records
Tax History
| Year | Tax Paid | Tax Assessment Tax Assessment Total Assessment is a certain percentage of the fair market value that is determined by local assessors to be the total taxable value of land and additions on the property. | Land | Improvement |
|---|---|---|---|---|
| 2025 | $1,915 | $68,363 | -- | -- |
| 2024 | $1,495 | $62,148 | -- | -- |
| 2023 | $1,495 | $109,474 | $48,000 | $61,474 |
| 2022 | $1,307 | $91,716 | $38,000 | $53,716 |
| 2021 | $1,152 | $70,884 | $22,000 | $48,884 |
| 2020 | $967 | $54,808 | $17,800 | $37,008 |
| 2019 | $996 | $57,778 | $17,000 | $40,778 |
| 2018 | $821 | $36,731 | $14,600 | $22,131 |
| 2017 | $764 | $33,384 | $12,000 | $21,384 |
| 2016 | $678 | $26,357 | $8,000 | $18,357 |
| 2015 | $670 | $25,575 | $8,000 | $17,575 |
| 2014 | $794 | $30,429 | $8,000 | $22,429 |
Source: Public Records
Map
Nearby Homes
- 1025 36th St
- 894 W Lake Holden Point
- 795 30th St
- 1018 38th St
- 4101 S Nashville Ave
- 1620 36th St
- 1426 30th St
- 3703 Auburndale Ave
- 3911 Auburndale Ave
- 1500 43rd St
- 1011 25th St
- 4528 S Shore Rd
- 3805 S Tampa Ave
- 4004 Barwood Dr Unit 3804
- 4531 Raymar Dr
- 4509 Patricia Ann Ct
- 2004 Ludlow Ln Unit 2803
- 2031 Ludlow Ln Unit 3303
- 1713 27th St
- 2022 Ludlow Ln Unit 2908
Your Personal Tour Guide
Ask me questions while you tour the home.