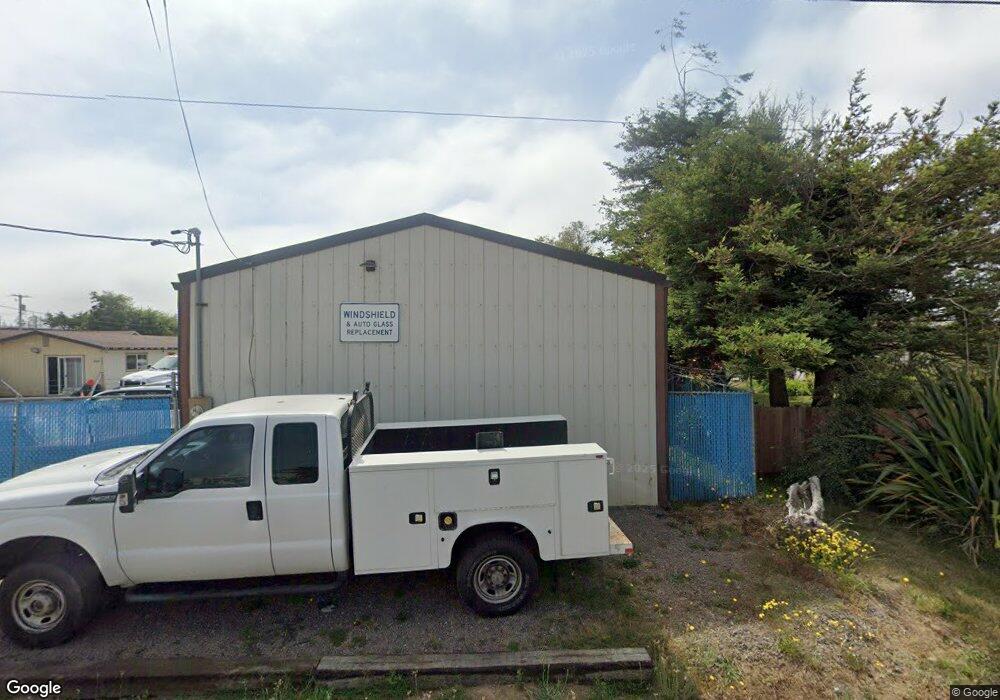
1150 Burtschell St Crescent City, CA 95531
Estimated Value: $192,977
1
Bed
1
Bath
900
Sq Ft
$214/Sq Ft
Est. Value
About This Home
This home is located at 1150 Burtschell St, Crescent City, CA 95531 and is currently estimated at $192,977, approximately $214 per square foot. 1150 Burtschell St is a home located in Del Norte County with nearby schools including Bess Maxwell Elementary School, Crescent Elk Middle School, and Del Norte High School.
Ownership History
Date
Name
Owned For
Owner Type
Purchase Details
Closed on
Jul 31, 2013
Sold by
Rude Nadine G
Bought by
Mejia Hernandez Daniel and Mejia Sarah
Current Estimated Value
Home Financials for this Owner
Home Financials are based on the most recent Mortgage that was taken out on this home.
Original Mortgage
$90,000
Outstanding Balance
$65,654
Interest Rate
3.92%
Mortgage Type
Seller Take Back
Estimated Equity
$127,323
Purchase Details
Closed on
Jun 21, 2012
Sold by
Cueva Alberto and Cueva Teresa
Bought by
Rude Nadine G
Purchase Details
Closed on
Jan 21, 2004
Sold by
Rude Nadine G
Bought by
Cueva Alberto and Cueva Teresa
Home Financials for this Owner
Home Financials are based on the most recent Mortgage that was taken out on this home.
Original Mortgage
$106,000
Interest Rate
5.86%
Mortgage Type
Seller Take Back
Create a Home Valuation Report for This Property
The Home Valuation Report is an in-depth analysis detailing your home's value as well as a comparison with similar homes in the area
Home Values in the Area
Average Home Value in this Area
Purchase History
| Date | Buyer | Sale Price | Title Company |
|---|---|---|---|
| Mejia Hernandez Daniel | $94,000 | Humboldt Land Title Company | |
| Rude Nadine G | $96,500 | Humboldt Land Title | |
| Cueva Alberto | $115,000 | First American Title Company |
Source: Public Records
Mortgage History
| Date | Status | Borrower | Loan Amount |
|---|---|---|---|
| Open | Mejia Hernandez Daniel | $90,000 | |
| Previous Owner | Cueva Alberto | $106,000 |
Source: Public Records
Tax History Compared to Growth
Tax History
| Year | Tax Paid | Tax Assessment Tax Assessment Total Assessment is a certain percentage of the fair market value that is determined by local assessors to be the total taxable value of land and additions on the property. | Land | Improvement |
|---|---|---|---|---|
| 2025 | $1,499 | $115,219 | $49,029 | $66,190 |
| 2024 | $1,499 | $112,961 | $48,068 | $64,893 |
| 2023 | $1,382 | $110,747 | $47,126 | $63,621 |
| 2022 | $1,358 | $108,576 | $46,202 | $62,374 |
| 2021 | $1,363 | $106,448 | $45,297 | $61,151 |
| 2020 | $1,244 | $105,357 | $44,833 | $60,524 |
| 2019 | $1,225 | $103,292 | $43,954 | $59,338 |
| 2018 | $1,203 | $101,268 | $43,093 | $58,175 |
| 2017 | $1,313 | $99,284 | $42,249 | $57,035 |
| 2016 | $1,290 | $97,338 | $41,421 | $55,917 |
| 2015 | $1,277 | $95,877 | $40,799 | $55,078 |
| 2014 | $1,257 | $94,000 | $40,000 | $54,000 |
Source: Public Records
Map
Nearby Homes
- 1102 Burtschell St
- 1210 Douglas St
- 1329 Burtschell Place
- 650 E Washington Blvd
- 650 E Washington Blvd Unit Crescent Senior Mobi
- 1093
- 373 Grant Ave
- 120 Tide St
- 160 Leif Cir
- 365 Leif Cir
- 525 Leif Cir
- 435 Leif Cir Unit Washington
- 0000 E Washington Blvd
- 145 Mason Ct
- 120 W Coolidge Ave
- 227 Ruchong Ln
- 1102 K St
- 724 Butte St
- 125 W Washington Blvd
- 1661 Northcrest Dr Unit Space 96
- 1120 Burtschell St
- 1125 Douglas St
- 1102 Burtchell St
- 1109 Douglas St
- 1191 Burtschell St
- 1205 Douglas St
- 1212 Burtschell St
- 00 Douglas Pkwy
- 1020 U S 101
- 1120 Douglas St
- 1225 Douglas St
- 1190 Douglas St
- 1108 Douglas St
- 1020 Burtschell St
- 1100 Douglas St
- 605 E Harding Ave
- 1039 Harrold St
- 1039 Harrold St
- 610 E Harding Ave
- 1070 U S 101