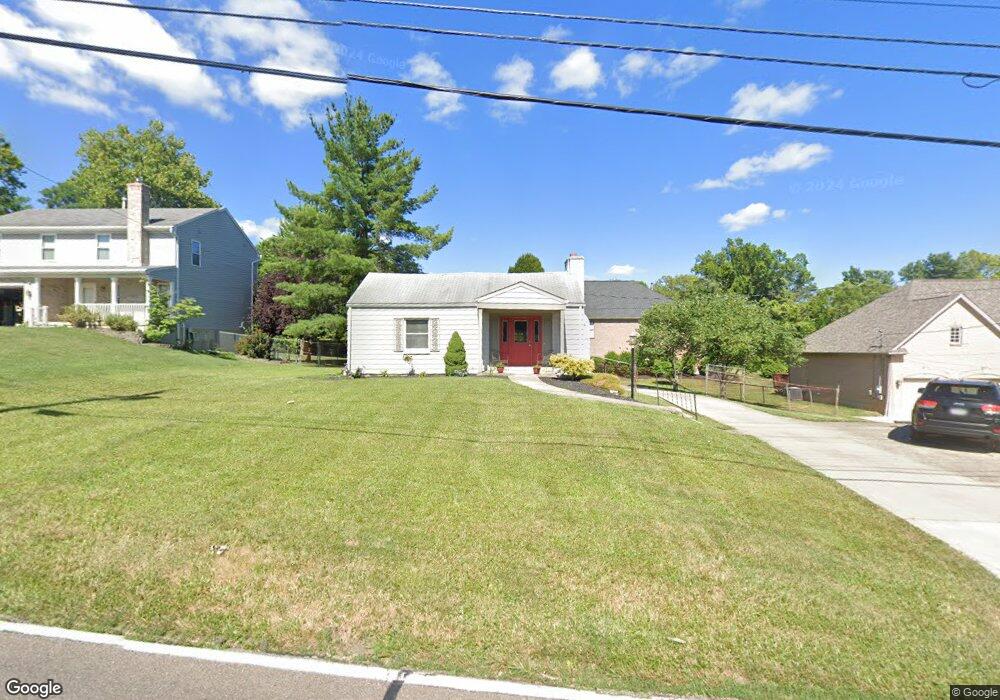
1150 Devils Backbone Rd Cincinnati, OH 45233
Cotillion Village NeighborhoodEstimated Value: $175,000 - $212,000
2
Beds
1
Bath
1,484
Sq Ft
$129/Sq Ft
Est. Value
About This Home
This home is located at 1150 Devils Backbone Rd, Cincinnati, OH 45233 and is currently estimated at $191,174, approximately $128 per square foot. 1150 Devils Backbone Rd is a home located in Hamilton County with nearby schools including John Foster Dulles Elementary School, Rapid Run Middle School, and Oak Hills High School.
Ownership History
Date
Name
Owned For
Owner Type
Purchase Details
Closed on
Jan 5, 2011
Sold by
Third Federal Savings & Loan Association
Bought by
Lewis Jason E and Lewis Laurie A
Current Estimated Value
Home Financials for this Owner
Home Financials are based on the most recent Mortgage that was taken out on this home.
Original Mortgage
$44,000
Interest Rate
6.75%
Mortgage Type
Adjustable Rate Mortgage/ARM
Purchase Details
Closed on
Aug 6, 2010
Sold by
Dreigon Richard J
Bought by
Third Federal Saving & Loan Association
Purchase Details
Closed on
Jan 31, 2005
Sold by
Dreigon Gail F
Bought by
Dreigon Richard J
Home Financials for this Owner
Home Financials are based on the most recent Mortgage that was taken out on this home.
Original Mortgage
$99,000
Interest Rate
5.8%
Mortgage Type
Unknown
Create a Home Valuation Report for This Property
The Home Valuation Report is an in-depth analysis detailing your home's value as well as a comparison with similar homes in the area
Home Values in the Area
Average Home Value in this Area
Purchase History
| Date | Buyer | Sale Price | Title Company |
|---|---|---|---|
| Lewis Jason E | -- | Stewart Title Company | |
| Third Federal Saving & Loan Association | $50,000 | Attorney | |
| Dreigon Richard J | -- | None Available |
Source: Public Records
Mortgage History
| Date | Status | Borrower | Loan Amount |
|---|---|---|---|
| Previous Owner | Lewis Jason E | $44,000 | |
| Previous Owner | Dreigon Richard J | $99,000 |
Source: Public Records
Tax History
| Year | Tax Paid | Tax Assessment Tax Assessment Total Assessment is a certain percentage of the fair market value that is determined by local assessors to be the total taxable value of land and additions on the property. | Land | Improvement |
|---|---|---|---|---|
| 2025 | $2,567 | $42,977 | $16,422 | $26,555 |
| 2024 | $2,504 | $42,977 | $16,422 | $26,555 |
| 2023 | $2,512 | $42,977 | $16,422 | $26,555 |
| 2022 | $2,218 | $33,706 | $15,278 | $18,428 |
| 2021 | $2,172 | $33,706 | $15,278 | $18,428 |
| 2020 | $2,203 | $33,706 | $15,278 | $18,428 |
| 2019 | $2,113 | $29,058 | $13,171 | $15,887 |
| 2018 | $2,115 | $29,058 | $13,171 | $15,887 |
| 2017 | $1,911 | $29,058 | $13,171 | $15,887 |
| 2016 | $1,183 | $17,903 | $13,199 | $4,704 |
| 2015 | $1,185 | $17,903 | $13,199 | $4,704 |
| 2014 | $1,186 | $17,903 | $13,199 | $4,704 |
| 2013 | $1,200 | $19,251 | $14,193 | $5,058 |
Source: Public Records
Map
Nearby Homes
- 5949 Cleves Warsaw Pike
- 6009 Cleves Warsaw Pike
- 837 Neeb Rd
- 1006 Pineknot Dr
- 5664 Rapid Run Rd
- 5671 Julmar Dr
- 5789 Juvene Way
- 1659 Devils Backbone Rd
- 712 Libbejo Dr
- 5773 Fourson Dr
- 1287 Heather Ridge
- 1711 Ebenezer Rd
- 5528 Cove Ct
- 6278 Gardenlake Ct
- 625 Conina Dr
- 1259 Wexford Ln
- 5466 Gwendolyn Ridge
- 5749 Beech Grove Ln
- 5496 Gwendolyn Ridge
- 571 Libbejo Dr
- 1176 Devils Backbone Rd
- 1148 Devils Backbone Rd
- 1185 Greenery Ln
- 1185 Greenery Ln Unit 17
- 1185 Devils Backbone Rd
- 1194 Devils Backbone Rd
- 1165 Devils Backbone Rd
- 1183 Greenery Ln
- 1183 Greenery Ln Unit 16
- 1187 Greenery Ln
- 1157 Devils Backbone Rd
- 1189 Devils Backbone Rd
- 1171 Devils Backbone Rd
- 5869 Glynn Ct
- 1113 Balmoral Dr
- 1123 Balmoral Dr
- 1149 Devils Backbone Rd
- 1181 Greenery Ln
- 1135 Balmoral Dr
- 1203 Devils Backbone Rd
Your Personal Tour Guide
Ask me questions while you tour the home.