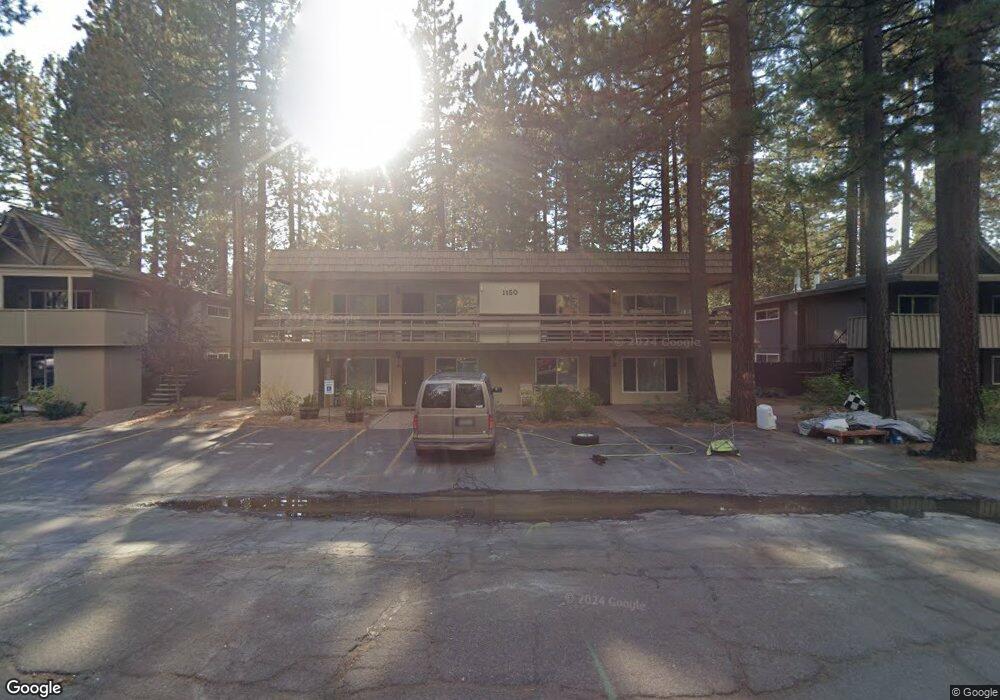
1150 Herbert Ave Unit C South Lake Tahoe, CA 96150
Estimated Value: $368,000 - $464,000
3
Beds
2
Baths
1,161
Sq Ft
$347/Sq Ft
Est. Value
About This Home
This home is located at 1150 Herbert Ave Unit C, South Lake Tahoe, CA 96150 and is currently estimated at $402,355, approximately $346 per square foot. 1150 Herbert Ave Unit C is a home located in El Dorado County with nearby schools including Bijou Community, South Tahoe Middle School, and South Tahoe High School.
Ownership History
Date
Name
Owned For
Owner Type
Purchase Details
Closed on
May 11, 2013
Sold by
Dexter Frederick L and Dexter Christine Rae
Bought by
Laing Christopher J and Laing Jennifer D
Current Estimated Value
Home Financials for this Owner
Home Financials are based on the most recent Mortgage that was taken out on this home.
Original Mortgage
$108,750
Outstanding Balance
$77,130
Interest Rate
3.5%
Mortgage Type
New Conventional
Estimated Equity
$325,225
Purchase Details
Closed on
Nov 16, 2004
Sold by
Beer Marilyn A
Bought by
Dexter Frederick L and Dexter Christine Rae
Home Financials for this Owner
Home Financials are based on the most recent Mortgage that was taken out on this home.
Original Mortgage
$239,600
Interest Rate
5.79%
Mortgage Type
Purchase Money Mortgage
Create a Home Valuation Report for This Property
The Home Valuation Report is an in-depth analysis detailing your home's value as well as a comparison with similar homes in the area
Home Values in the Area
Average Home Value in this Area
Purchase History
| Date | Buyer | Sale Price | Title Company |
|---|---|---|---|
| Laing Christopher J | $145,000 | Placer Title Company | |
| Dexter Frederick L | $299,500 | Fidelity Natl Title Co |
Source: Public Records
Mortgage History
| Date | Status | Borrower | Loan Amount |
|---|---|---|---|
| Open | Laing Christopher J | $108,750 | |
| Previous Owner | Dexter Frederick L | $239,600 |
Source: Public Records
Tax History Compared to Growth
Tax History
| Year | Tax Paid | Tax Assessment Tax Assessment Total Assessment is a certain percentage of the fair market value that is determined by local assessors to be the total taxable value of land and additions on the property. | Land | Improvement |
|---|---|---|---|---|
| 2025 | $1,952 | $178,541 | $24,620 | $153,921 |
| 2024 | $1,952 | $175,041 | $24,138 | $150,903 |
| 2023 | $1,913 | $171,610 | $23,665 | $147,945 |
| 2022 | $1,900 | $168,246 | $23,201 | $145,045 |
| 2021 | $1,871 | $164,948 | $22,747 | $142,201 |
| 2020 | $1,845 | $163,257 | $22,514 | $140,743 |
| 2019 | $1,836 | $160,057 | $22,073 | $137,984 |
| 2018 | $1,796 | $156,920 | $21,641 | $135,279 |
| 2017 | $1,768 | $153,844 | $21,217 | $132,627 |
| 2016 | $1,777 | $154,828 | $20,801 | $134,027 |
| 2015 | $1,759 | $152,565 | $20,490 | $132,075 |
| 2014 | $1,689 | $149,657 | $20,090 | $129,567 |
Source: Public Records
Map
Nearby Homes
- 1115 Glenwood Way
- 1151 Herbert Ave Unit B
- 3520 Cloverdale Ave
- 1201 Glenwood Way
- 1160 Bowers Ave
- 3508 Fawn Way
- 3546 Spruce Ave
- 3608 Aspen Ave
- 1291 Peninsula Rd
- 1022 Fairway Ave
- 3715 Blackwood Rd
- 1309 Peninsula Rd
- 3596 Terry Ln Unit 45
- 1094 Johnson Blvd
- 3740 Blackwood Rd Unit 42
- 3740 Blackwood Rd Unit 55
- 3740 Blackwood Rd Unit 61
- 3740 Blackwood Rd Unit 32
- 920 Balbijou Rd Unit 229
- 1304 Susie Lake Rd
- 1150 Herbert Ave
- 1150 Herbert Ave Unit A
- 1150 Herbert Ave Unit D
- 1150 Herbert Ave Unit B
- 1160 Herbert Ave Unit C
- 1160 Herbert Ave Unit A
- 1160 Herbert Ave Unit D
- 1160 Herbert Ave Unit B
- 1148 Herbert Ave Unit C
- 1148 Herbert Ave Unit A
- 1148 Herbert Ave Unit d
- 1148 Herbert Ave Unit B
- 1133 Glenwood Way
- 1147 Glenwood Way
- 1129 Glenwood Way
- 1140 Herbert Ave Unit C
- 1140 Herbert Ave Unit A
- 1140 Herbert Ave Unit D
- 1140 Herbert Ave Unit B
- 1168 Herbert Ave Unit Condo B