1150 Hull Ct Aurora, IL 60504
Waubonsie NeighborhoodEstimated Value: $406,480 - $436,000
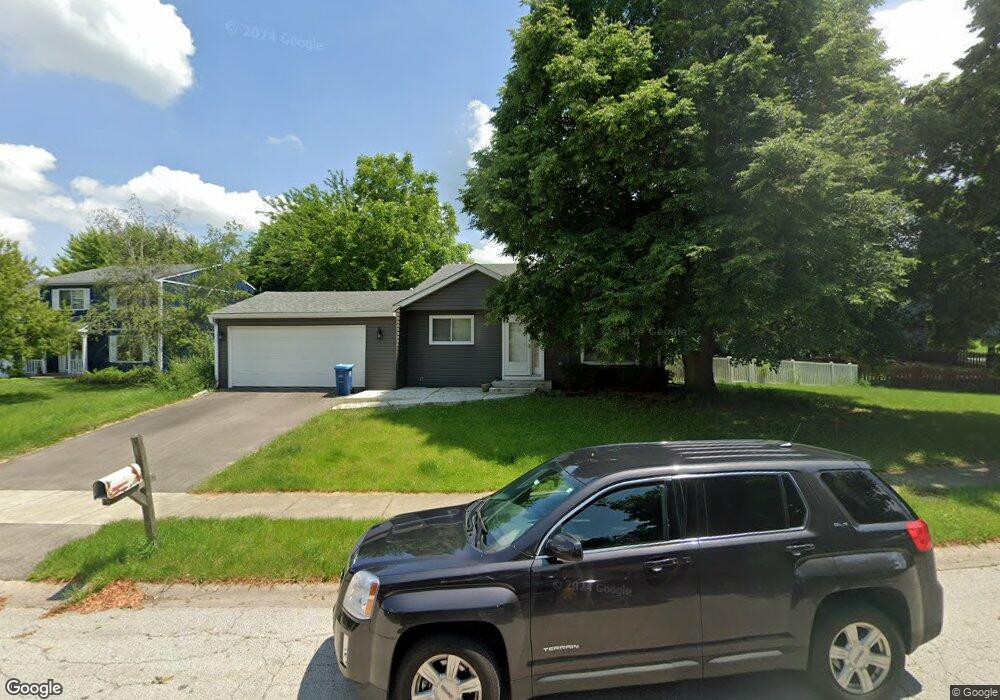
About This Home
This home is located at 1150 Hull Ct, Aurora, IL 60504 and is currently estimated at $419,870, approximately $333 per square foot. 1150 Hull Ct is a home located in DuPage County with nearby schools including Steck Elementary School, Fischer Middle School, and Waubonsie Valley High School.
Ownership History
We collect this data history from publicly available records. To have your information removed, we recommend requesting removal directly through your county’s website.
Purchase Details
Home Financials for this Owner
Home Financials are based on the most recent Mortgage that was taken out on this home.Purchase Details
Home Financials for this Owner
Home Financials are based on the most recent Mortgage that was taken out on this home.Purchase Details
Home Financials for this Owner
Home Financials are based on the most recent Mortgage that was taken out on this home.Home Values in the Area
Average Home Value in this Area
Purchase History
We collect this data history from publicly available records. To have your information removed, we recommend requesting removal directly through your county’s website.
| Date | Buyer | Sale Price | Title Company |
|---|---|---|---|
| $250,000 | Ticor Title Insurance Compan | ||
| $160,000 | -- | ||
| $156,500 | Law Title Insurance |
Mortgage History
We collect this data history from publicly available records. To have your information removed, we recommend requesting removal directly through your county’s website.
| Date | Status | Borrower | Loan Amount |
|---|---|---|---|
| Open | $160,050 | ||
| Previous Owner | $151,900 | ||
| Previous Owner | $125,200 |
Tax History
We collect this data history from publicly available records. To have your information removed, we recommend requesting removal directly through your county’s website.
| Year | Tax Paid | Tax Assessment Tax Assessment Total Assessment is a certain percentage of the fair market value that is determined by local assessors to be the total taxable value of land and additions on the property. | Land | Improvement |
|---|---|---|---|---|
| 2024 | $7,300 | $104,012 | $21,357 | $82,655 |
| 2023 | $6,770 | $93,460 | $19,190 | $74,270 |
| 2022 | $6,770 | $86,730 | $17,580 | $69,150 |
| 2021 | $6,586 | $83,630 | $16,950 | $66,680 |
| 2020 | $6,666 | $83,630 | $16,950 | $66,680 |
| 2019 | $6,424 | $79,540 | $16,120 | $63,420 |
| 2018 | $6,271 | $77,000 | $15,480 | $61,520 |
| 2017 | $6,161 | $74,380 | $14,950 | $59,430 |
| 2016 | $6,045 | $71,380 | $14,350 | $57,030 |
| 2015 | $5,975 | $67,770 | $13,620 | $54,150 |
| 2014 | $5,807 | $64,280 | $12,800 | $51,480 |
| 2013 | $5,748 | $64,730 | $12,890 | $51,840 |
Map
- 2250 Bannister Ln Unit 9
- 2490 Lakeside Dr Unit 12
- 1640 Edinburgh Ct
- 2595 Autumn Grove Ct
- 1410 Ashton Ct
- 2475 Ridge Ave Unit 8B
- 2070 Foxtail Dr
- 1740 Cumberland Rd Unit 8B
- 2655 Lindrick Ln
- 1804 Thornapple Way
- 1730 Spring Mist Ln
- 2475 Westleigh Ct
- 1033 Serendipity Dr Unit 3212
- 1041 Serendipity Dr
- 697 Periwinkle Ln Unit 7
- 984 Four Seasons Blvd Unit 1183
- 1066 Four Seasons Blvd Unit 1114
- 1335 Lawrence Ct
- 461 Breckenridge Dr
- 441 Breckenridge Dr
- 1140 Hull Ct
- 2220 Walcott Rd
- 2230 Walcott Rd
- 1145 Hull Ct Unit 10
- 1135 Hull Ct
- 1155 Hull Ct
- 1165 Hull Ct
- 2240 Walcott Rd
- 1130 Hull Ct Unit 10
- 1125 Hull Ct
- 2210 Walcott Rd
- 1120 Hull Ct
- 1115 Hull Ct
- 2225 Walcott Rd Unit 10
- 2250 Walcott Rd
- 2210 Lakeside Dr Unit 10
- 2235 Walcott Rd
- 2245 Walcott Rd
- 2265 Fox Valley Ct
- 2255 Fox Valley Ct
Ask me questions while you tour the home.