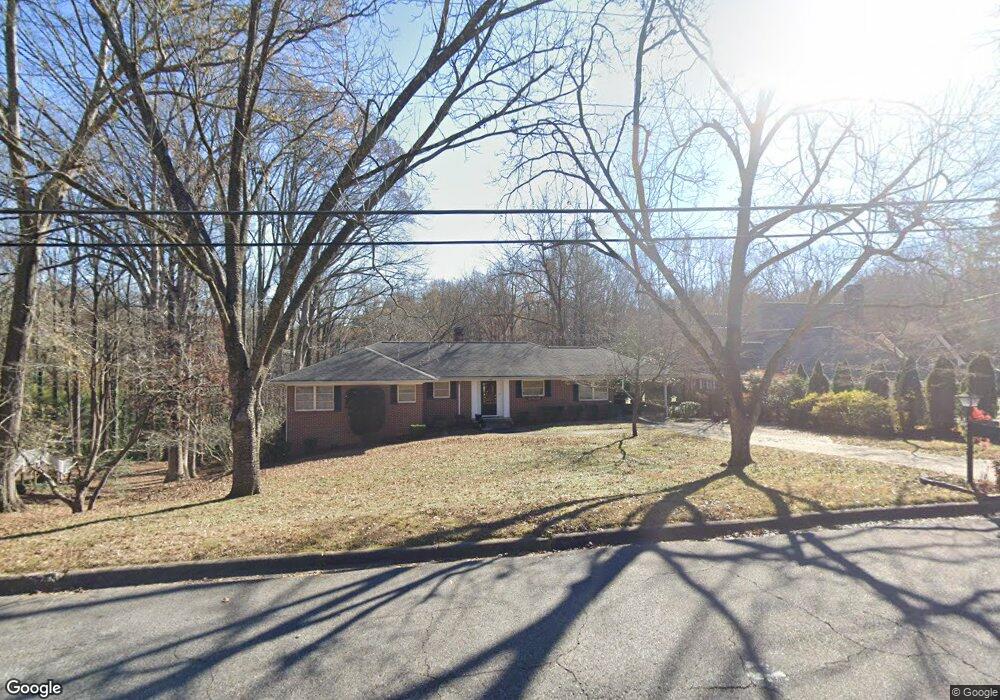
1150 Springdale Rd Gainesville, GA 30501
Estimated Value: $450,053 - $509,000
3
Beds
2
Baths
1,710
Sq Ft
$273/Sq Ft
Est. Value
About This Home
This home is located at 1150 Springdale Rd, Gainesville, GA 30501 and is currently estimated at $466,513, approximately $272 per square foot. 1150 Springdale Rd is a home located in Hall County with nearby schools including Enota Multiple Intelligences Academy, Gainesville Middle School, and Gainesville High School.
Ownership History
Date
Name
Owned For
Owner Type
Purchase Details
Closed on
Aug 21, 2020
Sold by
Redmon James Virgil
Bought by
Redmon Harriett Jane
Current Estimated Value
Purchase Details
Closed on
Jul 24, 2008
Sold by
Redmon Harriett J
Bought by
Redmon James
Home Financials for this Owner
Home Financials are based on the most recent Mortgage that was taken out on this home.
Original Mortgage
$140,000
Interest Rate
6.27%
Mortgage Type
New Conventional
Purchase Details
Closed on
Apr 15, 2008
Sold by
Putman Felton R
Bought by
Putman James R and Redmon Jane
Create a Home Valuation Report for This Property
The Home Valuation Report is an in-depth analysis detailing your home's value as well as a comparison with similar homes in the area
Home Values in the Area
Average Home Value in this Area
Purchase History
| Date | Buyer | Sale Price | Title Company |
|---|---|---|---|
| Redmon Harriett Jane | -- | -- | |
| Redmon James | -- | -- | |
| Redmon Jane P | $133,400 | -- | |
| Putman James R | -- | -- |
Source: Public Records
Mortgage History
| Date | Status | Borrower | Loan Amount |
|---|---|---|---|
| Previous Owner | Redmon Jane P | $140,000 |
Source: Public Records
Tax History Compared to Growth
Tax History
| Year | Tax Paid | Tax Assessment Tax Assessment Total Assessment is a certain percentage of the fair market value that is determined by local assessors to be the total taxable value of land and additions on the property. | Land | Improvement |
|---|---|---|---|---|
| 2025 | $4,258 | $214,080 | $69,400 | $144,680 |
| 2024 | $4,668 | $163,280 | $50,160 | $113,120 |
| 2023 | $442 | $150,040 | $66,080 | $83,960 |
| 2022 | $527 | $138,560 | $51,640 | $86,920 |
| 2021 | $593 | $113,840 | $33,560 | $80,280 |
| 2020 | $3,309 | $110,080 | $33,560 | $76,520 |
| 2019 | $3,590 | $148,480 | $66,800 | $81,680 |
| 2018 | $831 | $140,080 | $66,800 | $73,280 |
| 2017 | $889 | $132,760 | $66,800 | $65,960 |
| 2016 | $2,656 | $87,680 | $34,560 | $53,120 |
| 2015 | $1,221 | $62,911 | $12,560 | $50,351 |
| 2014 | $1,221 | $62,911 | $12,560 | $50,351 |
Source: Public Records
Map
Nearby Homes
- 1180 Springdale Rd
- 1173 Saint Charles Place
- 549 Park Street Place
- 610 Candler St
- 605 Candler St
- 605 Candler St Unit C9
- 1436 Vine St NE
- 909 Parkhill Place
- 1304 Vine St NE
- 943 Parkhill Place
- 1387 Springdale Rd
- 1971 Assembly (Lot 164) Cir
- 1505 Robinhood Trail
- 602 Dyer St
- 306 Vinings Walk NW
- 384 Forrest Ave
- 00 Jesse Jewell Pkwy
- 372 Forrest Ave
- 1120 Springdale Rd
- 1164 Springdale Rd
- 1133 Springdale Rd
- 1117 Springdale Rd
- 1147 Springdale Rd
- 1179 Springdale Rd
- 590 Park Street Place
- 1140 Glenwood Dr
- 1194 Springdale Rd
- 1126 Glenwood Dr
- 1154 Glenwood Dr
- 1169 Saint Charles Place
- 1173 St Charles Place
- 1094 Glenwood Dr
- 1193 Springdale Rd
- 631 Park Street Place
- 1174 Saint Charles Place
- 1086 Glenwood Dr
- 1169 St Charles Place
- 576 Park Street Place