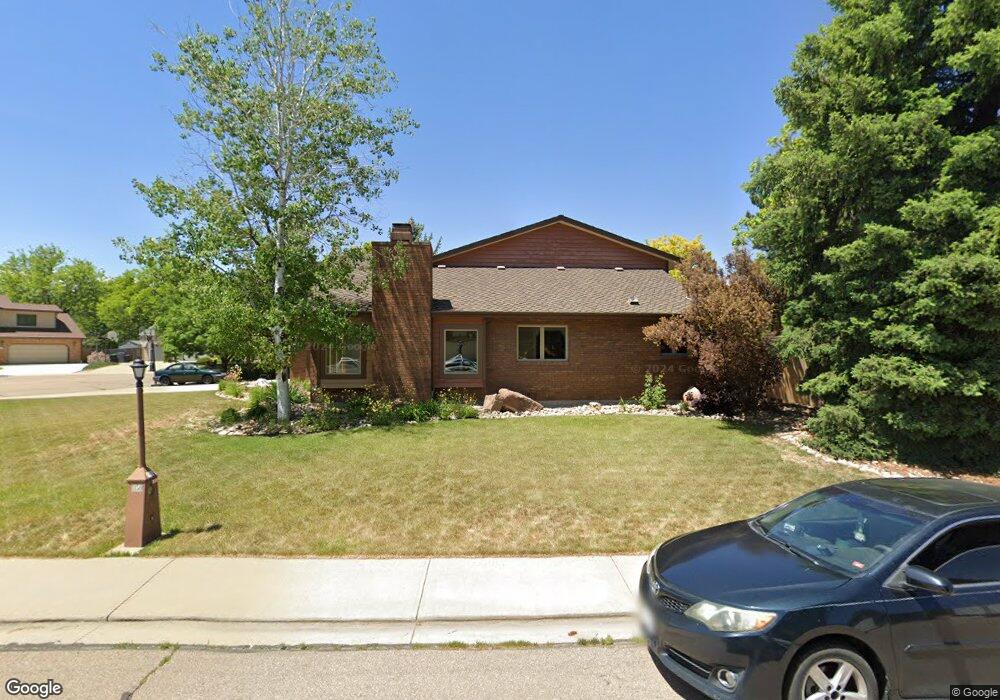
1150 Twin Peaks Cir Longmont, CO 80503
Longmont Estates NeighborhoodEstimated Value: $712,000 - $765,000
4
Beds
3
Baths
2,558
Sq Ft
$289/Sq Ft
Est. Value
About This Home
This home is located at 1150 Twin Peaks Cir, Longmont, CO 80503 and is currently estimated at $738,187, approximately $288 per square foot. 1150 Twin Peaks Cir is a home located in Boulder County with nearby schools including Longmont Estates Elementary School, Westview Middle School, and Silver Creek High School.
Ownership History
Date
Name
Owned For
Owner Type
Purchase Details
Closed on
Aug 20, 2009
Sold by
Bladt Jeffrey J and Bladt Lori A C
Bought by
Bladt Jeffrey J
Current Estimated Value
Home Financials for this Owner
Home Financials are based on the most recent Mortgage that was taken out on this home.
Original Mortgage
$229,000
Outstanding Balance
$148,928
Interest Rate
5.16%
Mortgage Type
New Conventional
Estimated Equity
$589,259
Purchase Details
Closed on
Jan 30, 1998
Sold by
Corbin Evonne G
Bought by
Bladt Jeffrey J
Home Financials for this Owner
Home Financials are based on the most recent Mortgage that was taken out on this home.
Original Mortgage
$204,400
Interest Rate
6.98%
Purchase Details
Closed on
Jan 13, 1988
Bought by
Bladt Jeffrey J
Purchase Details
Closed on
Mar 16, 1987
Bought by
Bladt Jeffrey J
Purchase Details
Closed on
Jul 10, 1984
Bought by
Bladt Jeffrey J
Create a Home Valuation Report for This Property
The Home Valuation Report is an in-depth analysis detailing your home's value as well as a comparison with similar homes in the area
Home Values in the Area
Average Home Value in this Area
Purchase History
| Date | Buyer | Sale Price | Title Company |
|---|---|---|---|
| Bladt Jeffrey J | -- | Land Title Guarantee Company | |
| Bladt Jeffrey J | $255,500 | -- | |
| Bladt Jeffrey J | -- | -- | |
| Bladt Jeffrey J | $28,000 | -- | |
| Bladt Jeffrey J | -- | -- |
Source: Public Records
Mortgage History
| Date | Status | Borrower | Loan Amount |
|---|---|---|---|
| Open | Bladt Jeffrey J | $229,000 | |
| Closed | Bladt Jeffrey J | $204,400 | |
| Closed | Bladt Jeffrey J | $10,000 |
Source: Public Records
Tax History Compared to Growth
Tax History
| Year | Tax Paid | Tax Assessment Tax Assessment Total Assessment is a certain percentage of the fair market value that is determined by local assessors to be the total taxable value of land and additions on the property. | Land | Improvement |
|---|---|---|---|---|
| 2025 | $4,070 | $41,969 | $10,094 | $31,875 |
| 2024 | $4,070 | $41,969 | $10,094 | $31,875 |
| 2023 | $4,014 | $42,545 | $11,263 | $34,967 |
| 2022 | $3,479 | $35,153 | $8,611 | $26,542 |
| 2021 | $3,524 | $36,165 | $8,859 | $27,306 |
| 2020 | $3,186 | $32,798 | $8,080 | $24,718 |
| 2019 | $3,136 | $32,798 | $8,080 | $24,718 |
| 2018 | $2,801 | $29,484 | $8,136 | $21,348 |
| 2017 | $2,763 | $32,596 | $8,995 | $23,601 |
| 2016 | $2,716 | $28,417 | $9,313 | $19,104 |
| 2015 | $2,588 | $24,239 | $7,244 | $16,995 |
| 2014 | $2,264 | $24,239 | $7,244 | $16,995 |
Source: Public Records
Map
Nearby Homes
- 1229 Twin Peaks Cir
- 3514 Mountain View Ave
- 3316 Camden Dr
- 3729 Doral Dr
- 3721 Columbia Dr
- 161 Baylor Dr
- 10930 N 85th St
- 3806 Findlay Ln
- 1440 Northwestern Rd
- 1345 Northwestern Rd
- 1106 Purdue Dr
- 1429 Auburn Ct
- 2900 Troxell Ave
- 1545 Drake St
- 2810 Humboldt Cir
- 3331 Lakeview Cir
- 8523 Hygiene Rd
- 2888 Humboldt Cir
- 1013 Berkeley Ct
- 825 Wade Rd
- 1144 Twin Peaks Cir
- 1152 Twin Peaks Cir
- 1142 Twin Peaks Cir
- 1147 Twin Peaks Cir
- 1154 Twin Peaks Cir
- 1145 Twin Peaks Cir
- 1158 Twin Peaks Cir
- 1149 Twin Peaks Cir
- 1140 Twin Peaks Cir
- 1133 Twin Peaks Cir
- 1156 Twin Peaks Cir
- 1159 Twin Peaks Cir
- 1156 Columbia Dr
- 1164 Columbia Dr
- 1162 Twin Peaks Cir
- 1134 Twin Peaks Cir
- 1172 Columbia Dr
- 1140 Columbia Dr
- 1138 Twin Peaks Cir
- 1161 Twin Peaks Cir