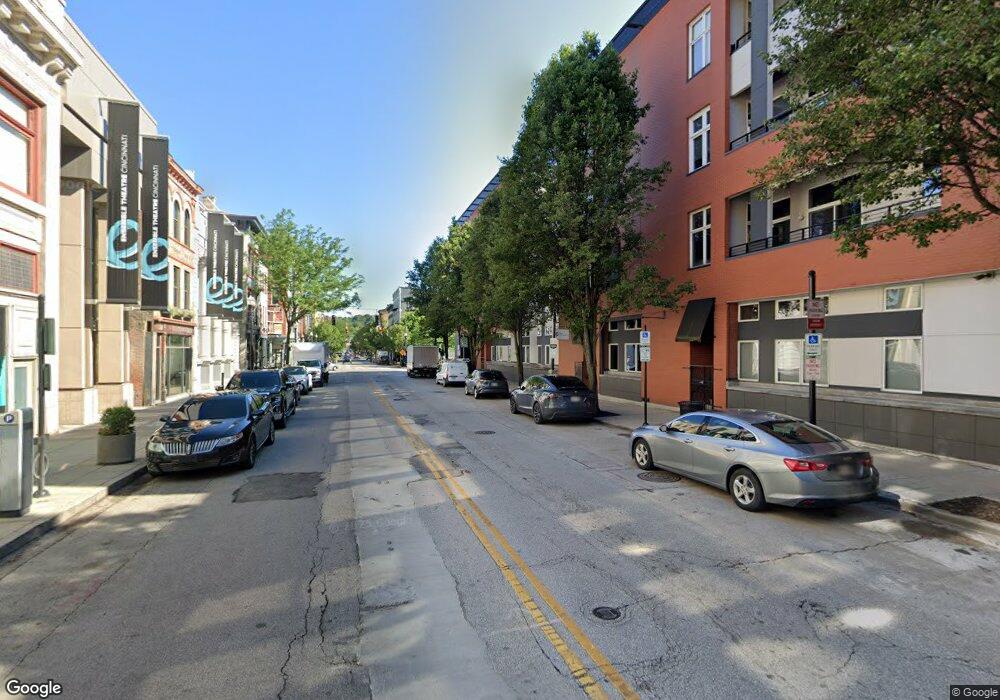
1150 Vine St Cincinnati, OH 45202
Over-The-Rhine NeighborhoodEstimated Value: $285,000 - $313,000
2
Beds
2
Baths
932
Sq Ft
$320/Sq Ft
Est. Value
About This Home
This home is located at 1150 Vine St, Cincinnati, OH 45202 and is currently estimated at $298,146, approximately $319 per square foot. 1150 Vine St is a home located in Hamilton County with nearby schools including Rothenberg Preparatory Academy, Robert A. Taft Information Technology High School, and Gilbert A. Dater High School.
Ownership History
Date
Name
Owned For
Owner Type
Purchase Details
Closed on
Mar 19, 2020
Sold by
Freese Craig
Bought by
Allouch Roula
Current Estimated Value
Home Financials for this Owner
Home Financials are based on the most recent Mortgage that was taken out on this home.
Original Mortgage
$236,000
Outstanding Balance
$158,164
Interest Rate
3.4%
Mortgage Type
New Conventional
Estimated Equity
$139,982
Purchase Details
Closed on
Oct 25, 2016
Sold by
Siferd Samuel T
Bought by
Grace J Tsau
Home Financials for this Owner
Home Financials are based on the most recent Mortgage that was taken out on this home.
Interest Rate
3.52%
Purchase Details
Closed on
Oct 14, 2016
Sold by
Siferd Samuel T and Sifred Virginia Vega
Bought by
Tsau Grace J
Home Financials for this Owner
Home Financials are based on the most recent Mortgage that was taken out on this home.
Interest Rate
3.52%
Purchase Details
Closed on
Mar 23, 2012
Sold by
Ne Vine/Central Llc
Bought by
Siferd Samuel T
Home Financials for this Owner
Home Financials are based on the most recent Mortgage that was taken out on this home.
Original Mortgage
$153,900
Interest Rate
3.9%
Mortgage Type
New Conventional
Create a Home Valuation Report for This Property
The Home Valuation Report is an in-depth analysis detailing your home's value as well as a comparison with similar homes in the area
Home Values in the Area
Average Home Value in this Area
Purchase History
| Date | Buyer | Sale Price | Title Company |
|---|---|---|---|
| Allouch Roula | $295,000 | None Available | |
| Grace J Tsau | $218,000 | -- | |
| Tsau Grace J | $213,000 | -- | |
| Siferd Samuel T | $162,000 | Attorney |
Source: Public Records
Mortgage History
| Date | Status | Borrower | Loan Amount |
|---|---|---|---|
| Open | Allouch Roula | $236,000 | |
| Previous Owner | Grace J Tsau | -- | |
| Previous Owner | Tsau Grace J | $178,760 | |
| Previous Owner | Siferd Samuel T | $153,900 |
Source: Public Records
Tax History
| Year | Tax Paid | Tax Assessment Tax Assessment Total Assessment is a certain percentage of the fair market value that is determined by local assessors to be the total taxable value of land and additions on the property. | Land | Improvement |
|---|---|---|---|---|
| 2025 | $5,246 | $82,208 | $14,700 | $67,508 |
| 2024 | $5,086 | $82,208 | $14,700 | $67,508 |
| 2023 | $5,250 | $82,208 | $14,700 | $67,508 |
| 2022 | $6,407 | $90,798 | $8,705 | $82,093 |
| 2021 | $6,160 | $90,798 | $8,705 | $82,093 |
| 2020 | $807 | $90,798 | $8,705 | $82,093 |
| 2019 | $542 | $76,300 | $7,315 | $68,985 |
| 2018 | $567 | $76,300 | $7,315 | $68,985 |
| 2017 | $540 | $76,300 | $7,315 | $68,985 |
| 2016 | $573 | $56,701 | $7,683 | $49,018 |
| 2015 | $492 | $56,701 | $7,683 | $49,018 |
| 2014 | $495 | $56,701 | $7,683 | $49,018 |
| 2013 | $480 | $54,863 | $7,315 | $47,548 |
Source: Public Records
Map
Nearby Homes
- 1150 Vine St Unit 41
- 1150 Vine St Unit 21
- 1150 Vine St Unit 24
- 1150 Vine St Unit 39
- 1150 Vine St Unit 27
- 1150 Vine St Unit 31
- 1150 Vine St
- 1150 Vine St
- 1150 Vine St
- 1150 Vine St
- 1150 Vine St
- 1150 Vine St
- 1150 Vine St
- 1150 Vine St
- 1150 Vine St
- 1150 Vine St
- 1150 Vine St
- 1150 Vine St
- 1150 Vine St
- 1150 Vine St
Your Personal Tour Guide
Ask me questions while you tour the home.