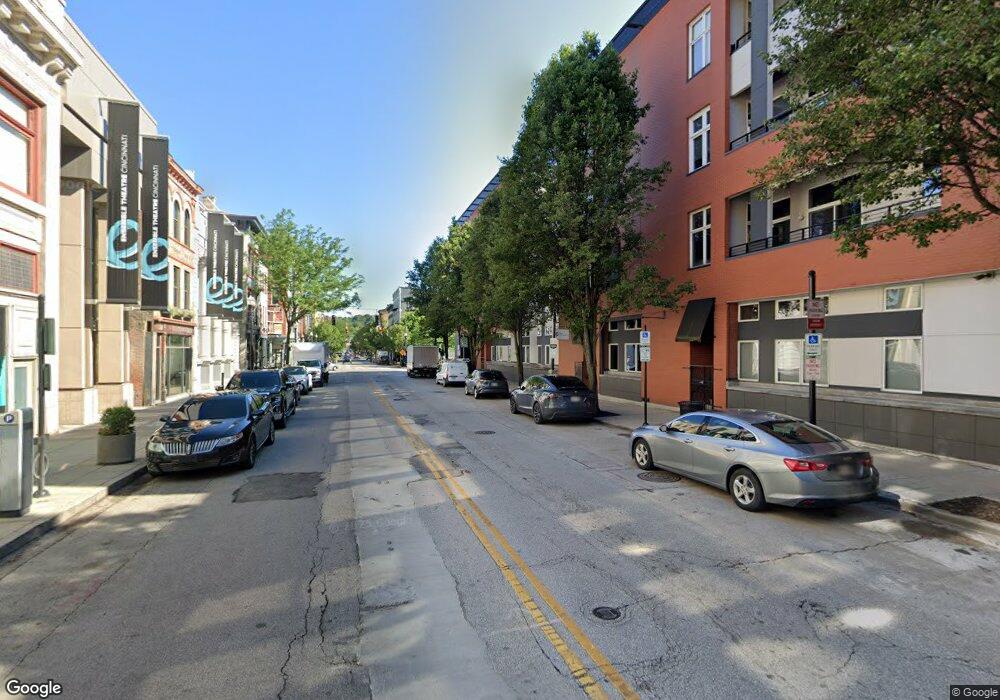
1150 Vine St Cincinnati, OH 45202
Over-The-Rhine NeighborhoodEstimated Value: $260,811 - $280,000
1
Bed
1
Bath
869
Sq Ft
$314/Sq Ft
Est. Value
About This Home
This home is located at 1150 Vine St, Cincinnati, OH 45202 and is currently estimated at $272,703, approximately $313 per square foot. 1150 Vine St is a home located in Hamilton County with nearby schools including Rothenberg Preparatory Academy, Robert A. Taft Information Technology High School, and Gilbert A. Dater High School.
Ownership History
Date
Name
Owned For
Owner Type
Purchase Details
Closed on
May 31, 2016
Sold by
Bublitz Rudolph G
Bought by
Otr Property Management Llc
Current Estimated Value
Purchase Details
Closed on
Oct 16, 2014
Sold by
Clodfelder James R
Bought by
Bublitz Rudolph G
Home Financials for this Owner
Home Financials are based on the most recent Mortgage that was taken out on this home.
Original Mortgage
$175,050
Interest Rate
3.25%
Mortgage Type
Adjustable Rate Mortgage/ARM
Purchase Details
Closed on
Oct 16, 2008
Sold by
Ne Vine/Central Llc
Bought by
Clodfelder James R
Home Financials for this Owner
Home Financials are based on the most recent Mortgage that was taken out on this home.
Original Mortgage
$119,000
Interest Rate
5.25%
Mortgage Type
Adjustable Rate Mortgage/ARM
Create a Home Valuation Report for This Property
The Home Valuation Report is an in-depth analysis detailing your home's value as well as a comparison with similar homes in the area
Home Values in the Area
Average Home Value in this Area
Purchase History
| Date | Buyer | Sale Price | Title Company |
|---|---|---|---|
| Otr Property Management Llc | $209,200 | -- | |
| Bublitz Rudolph G | $194,500 | Prominent Title Agency Llc | |
| Clodfelder James R | $159,000 | None Available |
Source: Public Records
Mortgage History
| Date | Status | Borrower | Loan Amount |
|---|---|---|---|
| Open | Strauss Karl J | $210,884 | |
| Previous Owner | Bublitz Rudolph G | $175,050 | |
| Previous Owner | Clodfelder James R | $119,000 |
Source: Public Records
Tax History Compared to Growth
Tax History
| Year | Tax Paid | Tax Assessment Tax Assessment Total Assessment is a certain percentage of the fair market value that is determined by local assessors to be the total taxable value of land and additions on the property. | Land | Improvement |
|---|---|---|---|---|
| 2024 | $5,403 | $82,527 | $14,700 | $67,827 |
| 2023 | $5,457 | $82,527 | $14,700 | $67,827 |
| 2022 | $6,363 | $87,133 | $8,082 | $79,051 |
| 2021 | $6,244 | $87,133 | $8,082 | $79,051 |
| 2020 | $776 | $87,133 | $8,082 | $79,051 |
| 2019 | $521 | $73,220 | $6,790 | $66,430 |
| 2018 | $544 | $73,220 | $6,790 | $66,430 |
| 2017 | $525 | $73,220 | $6,790 | $66,430 |
| 2016 | $532 | $58,433 | $7,130 | $51,303 |
| 2015 | $456 | $58,433 | $7,130 | $51,303 |
| 2014 | $460 | $58,433 | $7,130 | $51,303 |
| 2013 | $445 | $55,650 | $6,790 | $48,860 |
Source: Public Records
Map
Nearby Homes
- 1150 Vine St Unit 41
- 1150 Vine St Unit 21
- 1150 Vine St Unit 24
- 1150 Vine St Unit 39
- 1150 Vine St Unit 27
- 1150 Vine St Unit 31
- 1150 Vine St
- 1150 Vine St
- 1150 Vine St
- 1150 Vine St
- 1150 Vine St
- 1150 Vine St
- 1150 Vine St
- 1150 Vine St
- 1150 Vine St
- 1150 Vine St
- 1150 Vine St
- 1150 Vine St
- 1150 Vine St
- 1150 Vine St