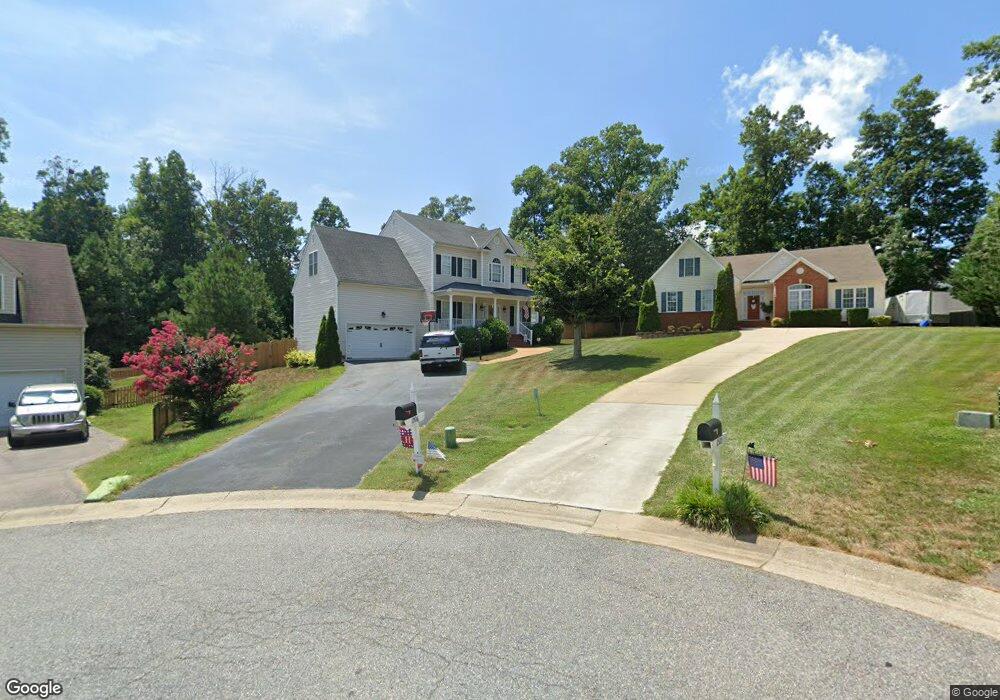
11506 Moven Ct Midlothian, VA 23114
Estimated Value: $511,758 - $547,000
4
Beds
3
Baths
2,554
Sq Ft
$208/Sq Ft
Est. Value
About This Home
This home is located at 11506 Moven Ct, Midlothian, VA 23114 and is currently estimated at $530,690, approximately $207 per square foot. 11506 Moven Ct is a home located in Chesterfield County with nearby schools including W W Gordon Elementary School, Midlothian Middle School, and Monacan High School.
Ownership History
Date
Name
Owned For
Owner Type
Purchase Details
Closed on
Nov 19, 2007
Sold by
Pmi Mortgage Insurance Co
Bought by
Hicks Mark A
Current Estimated Value
Home Financials for this Owner
Home Financials are based on the most recent Mortgage that was taken out on this home.
Original Mortgage
$214,400
Outstanding Balance
$136,351
Interest Rate
6.48%
Mortgage Type
New Conventional
Estimated Equity
$394,339
Purchase Details
Closed on
Mar 12, 2007
Sold by
Federal Nat'L Mtg Assoc
Bought by
Pmi Mortgage Insurance Co
Purchase Details
Closed on
Feb 23, 2004
Sold by
Grand Homes
Bought by
Bowlin Stephen
Home Financials for this Owner
Home Financials are based on the most recent Mortgage that was taken out on this home.
Original Mortgage
$235,077
Interest Rate
5.65%
Mortgage Type
New Conventional
Create a Home Valuation Report for This Property
The Home Valuation Report is an in-depth analysis detailing your home's value as well as a comparison with similar homes in the area
Home Values in the Area
Average Home Value in this Area
Purchase History
| Date | Buyer | Sale Price | Title Company |
|---|---|---|---|
| Hicks Mark A | $285,000 | -- | |
| Pmi Mortgage Insurance Co | $285,000 | -- | |
| Bowlin Stephen | $247,450 | -- |
Source: Public Records
Mortgage History
| Date | Status | Borrower | Loan Amount |
|---|---|---|---|
| Open | Hicks Mark A | $214,400 | |
| Previous Owner | Bowlin Stephen | $235,077 |
Source: Public Records
Tax History
| Year | Tax Paid | Tax Assessment Tax Assessment Total Assessment is a certain percentage of the fair market value that is determined by local assessors to be the total taxable value of land and additions on the property. | Land | Improvement |
|---|---|---|---|---|
| 2025 | $4,225 | $471,900 | $72,000 | $399,900 |
| 2024 | $4,225 | $439,600 | $67,000 | $372,600 |
| 2023 | $3,846 | $422,600 | $65,000 | $357,600 |
| 2022 | $3,536 | $384,300 | $62,000 | $322,300 |
| 2021 | $3,226 | $336,900 | $60,000 | $276,900 |
| 2020 | $3,201 | $336,900 | $60,000 | $276,900 |
| 2019 | $3,078 | $324,000 | $60,000 | $264,000 |
| 2018 | $2,957 | $311,300 | $60,000 | $251,300 |
| 2017 | $2,804 | $292,100 | $60,000 | $232,100 |
| 2016 | $2,721 | $283,400 | $60,000 | $223,400 |
| 2015 | $2,613 | $272,200 | $60,000 | $212,200 |
| 2014 | $2,581 | $268,900 | $60,000 | $208,900 |
Source: Public Records
Map
Nearby Homes
- 11724 Duxbury Ct
- 11625 Explorer Dr
- 11806 Winbury Ct
- 11906 Lockett Ridge Place
- 11401 Mansfield Crossing Ln
- 11400 Crawford Wood Terrace
- 11301 Mansfield Crossing Ct
- 11211 Pennway Dr
- 636 Coralberry Dr
- 706 Gordon School Ct
- 11101 Pennway Dr
- 11317 Lady Slipper Ln
- 1100 Somerville Grove Terrace
- 12409 Avon Lake Cir
- 2019 Condrey Ridge Dr
- 2006 Bethany Ridge Terrace
- 12601 Cottage Mill Rd
- 12509 Triton Springs Dr
- 12536 St Thomas Ct
- 12604 Walton Lake Dr
- 11500 Moven Ct
- 11512 Moven Ct
- 11507 Moven Ct
- 11701 Sanbury Ln
- 11743 Nevis Dr
- 11700 Sanbury Ln
- 11737 Nevis Dr
- 11524 Moven Ct
- 11707 Sanbury Ln
- 11800 Moven Place
- 11749 Nevis Dr
- 11731 Nevis Dr
- 11513 Moven Ct
- 0 Moven Ct
- 11519 Moven Ct
- 11706 Sanbury Ln
- 11806 Moven Place
- 11725 Nevis Dr
- 0 Moven Dr
- 11801 Nevis Dr
Your Personal Tour Guide
Ask me questions while you tour the home.