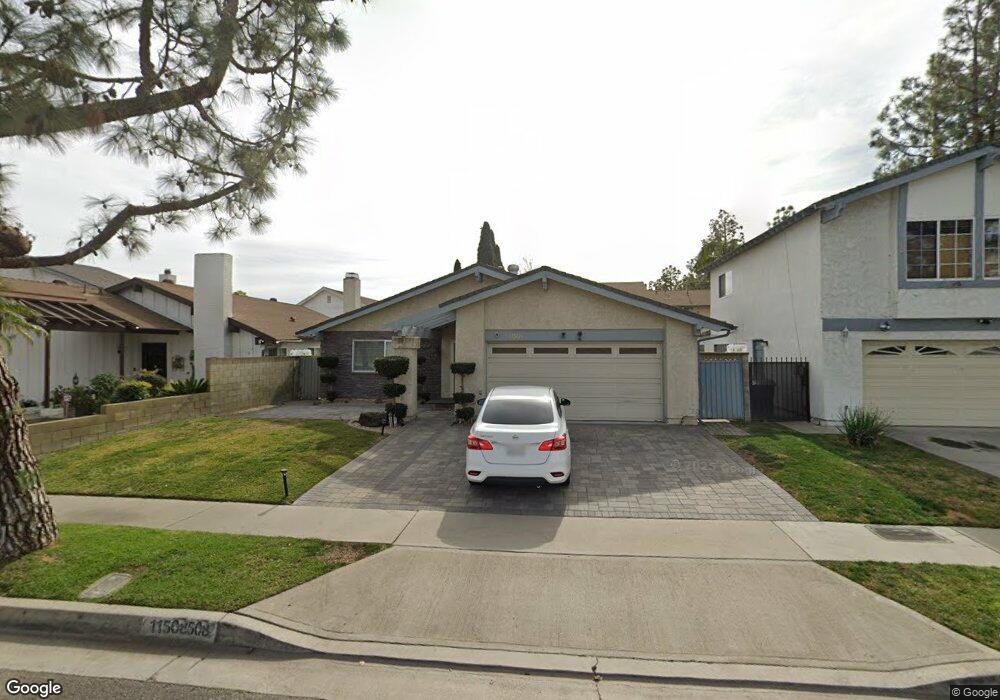
11508 Bos St Cerritos, CA 90703
Estimated Value: $1,034,862 - $1,109,000
3
Beds
2
Baths
1,753
Sq Ft
$616/Sq Ft
Est. Value
About This Home
This home is located at 11508 Bos St, Cerritos, CA 90703 and is currently estimated at $1,079,716, approximately $615 per square foot. 11508 Bos St is a home located in Los Angeles County with nearby schools including Bragg Elementary School, Haskell Stem Academy, and Gahr High School.
Ownership History
Date
Name
Owned For
Owner Type
Purchase Details
Closed on
Apr 11, 2001
Sold by
Stokes Michael
Bought by
Cornett Lateicia J
Current Estimated Value
Home Financials for this Owner
Home Financials are based on the most recent Mortgage that was taken out on this home.
Original Mortgage
$230,000
Outstanding Balance
$85,039
Interest Rate
7.06%
Estimated Equity
$994,677
Purchase Details
Closed on
Dec 14, 1999
Sold by
Johnson Lashawnda
Bought by
Cornett Latecia
Purchase Details
Closed on
Oct 16, 1995
Sold by
Stokes Latecia
Bought by
Johnson Lashawnda
Purchase Details
Closed on
Jun 16, 1995
Sold by
Souza Reynold F
Bought by
Stokes Latecia
Home Financials for this Owner
Home Financials are based on the most recent Mortgage that was taken out on this home.
Original Mortgage
$194,184
Interest Rate
7.59%
Create a Home Valuation Report for This Property
The Home Valuation Report is an in-depth analysis detailing your home's value as well as a comparison with similar homes in the area
Home Values in the Area
Average Home Value in this Area
Purchase History
| Date | Buyer | Sale Price | Title Company |
|---|---|---|---|
| Cornett Lateicia J | -- | First American Title Co | |
| Cornett Latecia | -- | -- | |
| Johnson Lashawnda | -- | -- | |
| Stokes Latecia | $216,000 | Continental Lawyers Title Co | |
| Stokes Latecia | -- | Continental Lawyers Title Co |
Source: Public Records
Mortgage History
| Date | Status | Borrower | Loan Amount |
|---|---|---|---|
| Open | Cornett Lateicia J | $230,000 | |
| Previous Owner | Stokes Latecia | $194,184 |
Source: Public Records
Tax History Compared to Growth
Tax History
| Year | Tax Paid | Tax Assessment Tax Assessment Total Assessment is a certain percentage of the fair market value that is determined by local assessors to be the total taxable value of land and additions on the property. | Land | Improvement |
|---|---|---|---|---|
| 2025 | $4,723 | $376,532 | $230,533 | $145,999 |
| 2024 | $4,723 | $369,150 | $226,013 | $143,137 |
| 2023 | $4,574 | $361,913 | $221,582 | $140,331 |
| 2022 | $4,504 | $354,818 | $217,238 | $137,580 |
| 2021 | $4,396 | $347,862 | $212,979 | $134,883 |
| 2019 | $4,296 | $337,546 | $206,663 | $130,883 |
| 2018 | $3,966 | $330,928 | $202,611 | $128,317 |
| 2016 | $3,799 | $318,080 | $194,745 | $123,335 |
| 2015 | $3,751 | $313,303 | $191,820 | $121,483 |
| 2014 | $3,682 | $307,167 | $188,063 | $119,104 |
Source: Public Records
Map
Nearby Homes
- 19731 Sally Ave
- 19127 Pioneer Blvd Unit 30
- 19127 Pioneer Blvd Unit 9
- 19127 Pioneer Blvd Unit SPC 23
- 19127 Pioneer Blvd Unit 27
- 18747 West Place
- 11702 Christy St
- 11540 187th St
- 11620 187th St
- 19518 Nancy Cir
- 19528 Ray Cir
- 19127 Allingham Ave
- 11702 Gloria Ct
- 11974 Bos St
- 20425 Harvest Ave
- 11518 205th St
- 6745 Yearling St
- 18425 Devlin Ave
- 12132 Cambrian Cir
- 11750 206th St Unit 7
- 11502 Bos St
- 19412 Lusk Ave
- 11518 Bos St
- 19405 Sheryl Cir
- 19416 Lusk Ave
- 19411 Sheryl Cir
- 11524 Bos St
- 19422 Lusk Ave
- 19403 Lusk Ave
- 19407 Lusk Ave
- 19417 Sheryl Cir
- 11534 Bos St
- 19413 Lusk Ave
- 19417 Lusk Ave
- 19426 Lusk Ave
- 19421 Sheryl Cir
- 19319 Sheryl Ave
- 19404 Sheryl Cir
- 19423 Lusk Ave
- 19410 Sheryl Cir