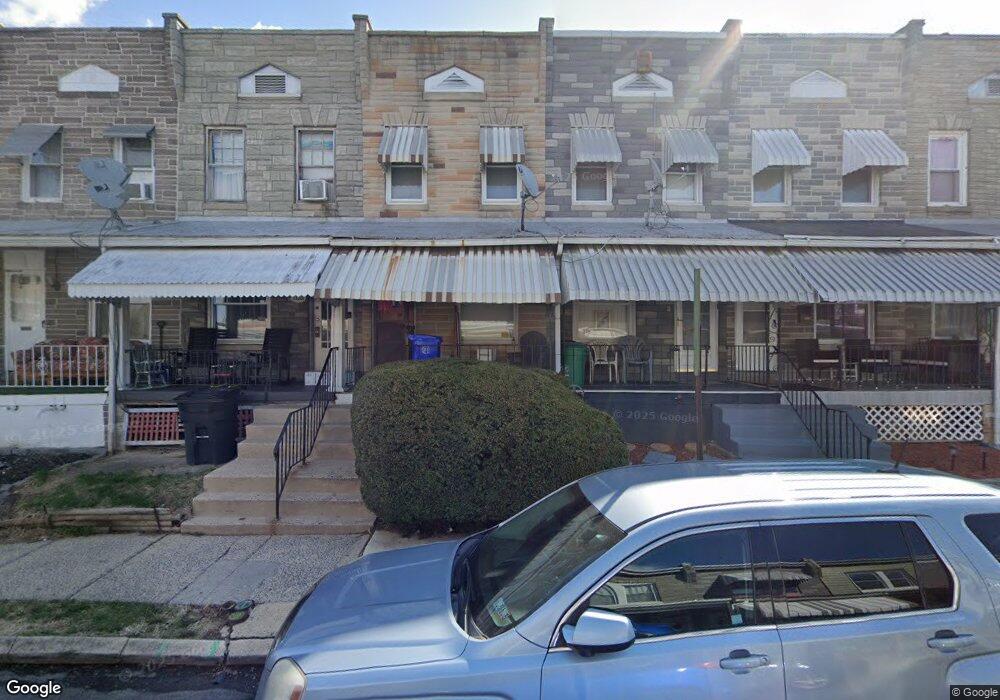
1151 Birch St Reading, PA 19604
Northeast Reading NeighborhoodEstimated Value: $104,000 - $149,000
3
Beds
1
Bath
936
Sq Ft
$133/Sq Ft
Est. Value
About This Home
This home is located at 1151 Birch St, Reading, PA 19604 and is currently estimated at $124,811, approximately $133 per square foot. 1151 Birch St is a home located in Berks County with nearby schools including Thirteenth & Union Elementary School, Northeast Middle School, and Reading Senior High School.
Ownership History
Date
Name
Owned For
Owner Type
Purchase Details
Closed on
Feb 13, 2009
Sold by
Villamil Johnny
Bought by
Williams Lasheander M
Current Estimated Value
Home Financials for this Owner
Home Financials are based on the most recent Mortgage that was taken out on this home.
Original Mortgage
$41,722
Outstanding Balance
$26,232
Interest Rate
5%
Mortgage Type
FHA
Estimated Equity
$98,579
Purchase Details
Closed on
Dec 11, 2003
Sold by
Sovereign Bank
Bought by
Villamil Johnny
Purchase Details
Closed on
Oct 17, 2003
Sold by
Morrison Ronneshia B
Bought by
Sovereign Bank
Purchase Details
Closed on
Jan 16, 2001
Sold by
Johnson Leland P
Bought by
Morrison Ronneshia B
Home Financials for this Owner
Home Financials are based on the most recent Mortgage that was taken out on this home.
Original Mortgage
$33,915
Interest Rate
7.52%
Create a Home Valuation Report for This Property
The Home Valuation Report is an in-depth analysis detailing your home's value as well as a comparison with similar homes in the area
Home Values in the Area
Average Home Value in this Area
Purchase History
| Date | Buyer | Sale Price | Title Company |
|---|---|---|---|
| Williams Lasheander M | $42,000 | None Available | |
| Villamil Johnny | $20,000 | -- | |
| Sovereign Bank | $1,100 | -- | |
| Morrison Ronneshia B | $39,900 | -- |
Source: Public Records
Mortgage History
| Date | Status | Borrower | Loan Amount |
|---|---|---|---|
| Open | Williams Lasheander M | $41,722 | |
| Previous Owner | Morrison Ronneshia B | $33,915 | |
| Closed | Morrison Ronneshia B | $6,500 |
Source: Public Records
Tax History Compared to Growth
Tax History
| Year | Tax Paid | Tax Assessment Tax Assessment Total Assessment is a certain percentage of the fair market value that is determined by local assessors to be the total taxable value of land and additions on the property. | Land | Improvement |
|---|---|---|---|---|
| 2025 | $980 | $36,100 | $15,000 | $21,100 |
| 2024 | $1,603 | $36,100 | $15,000 | $21,100 |
| 2023 | $1,578 | $36,100 | $15,000 | $21,100 |
| 2022 | $1,578 | $36,100 | $15,000 | $21,100 |
| 2021 | $1,578 | $36,100 | $15,000 | $21,100 |
| 2020 | $1,562 | $36,100 | $15,000 | $21,100 |
| 2019 | $1,562 | $36,100 | $15,000 | $21,100 |
| 2018 | $1,562 | $36,100 | $15,000 | $21,100 |
| 2017 | $1,552 | $36,100 | $15,000 | $21,100 |
| 2016 | $647 | $36,100 | $15,000 | $21,100 |
| 2015 | $887 | $36,100 | $15,000 | $21,100 |
| 2014 | $816 | $36,100 | $15,000 | $21,100 |
Source: Public Records
Map
Nearby Homes
- 1229 Robeson St
- 1019 Birch St
- 920 Hampden Blvd
- 918 Locust St
- 1217 Windsor St
- 1205 Windsor St
- 912 Locust St
- 1120 N 10th St
- 1148 N 10th St
- 1212 N 10th St
- 1343 Mulberry St
- 1347 Mulberry St
- 842 N 12th St
- 1317 N 10th St
- 1053 Moss St
- 1302 N 10th St
- 818 N 12th St
- 840 N 11th St
- 1357 N 10th St
- 1115 Douglass St