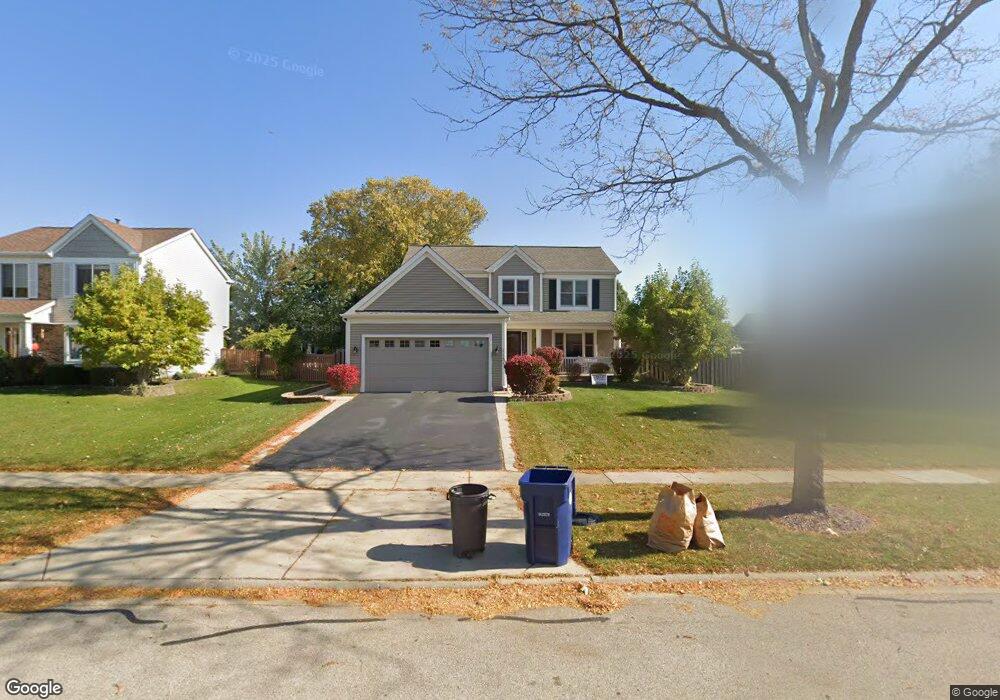
1151 Dawson Ln Algonquin, IL 60102
Estimated Value: $411,000 - $448,000
4
Beds
3
Baths
1,876
Sq Ft
$229/Sq Ft
Est. Value
About This Home
This home is located at 1151 Dawson Ln, Algonquin, IL 60102 and is currently estimated at $429,232, approximately $228 per square foot. 1151 Dawson Ln is a home located in McHenry County with nearby schools including Westfield Community School, Kenneth E Neubert Elementary School, and Harry D Jacobs High School.
Ownership History
Date
Name
Owned For
Owner Type
Purchase Details
Closed on
Mar 17, 2025
Sold by
Demma Anthony S and Demma Susan E
Bought by
Demma Family Trust and Demma
Current Estimated Value
Purchase Details
Closed on
Apr 19, 1999
Sold by
Robb Russell S and Robb Francene M
Bought by
Demma Anthony S and Demma Susan E
Home Financials for this Owner
Home Financials are based on the most recent Mortgage that was taken out on this home.
Original Mortgage
$149,600
Interest Rate
7.04%
Purchase Details
Closed on
Jul 29, 1996
Sold by
Pulte Home Corp
Bought by
Robb Russell S and Robb Francene M
Home Financials for this Owner
Home Financials are based on the most recent Mortgage that was taken out on this home.
Original Mortgage
$166,500
Interest Rate
5.75%
Create a Home Valuation Report for This Property
The Home Valuation Report is an in-depth analysis detailing your home's value as well as a comparison with similar homes in the area
Purchase History
| Date | Buyer | Sale Price | Title Company |
|---|---|---|---|
| Demma Family Trust | -- | None Listed On Document | |
| Demma Anthony S | $187,000 | Chicago Title | |
| Robb Russell S | $175,500 | 1St American Title |
Source: Public Records
Mortgage History
| Date | Status | Borrower | Loan Amount |
|---|---|---|---|
| Previous Owner | Demma Anthony S | $149,600 | |
| Previous Owner | Robb Russell S | $166,500 |
Source: Public Records
Tax History
| Year | Tax Paid | Tax Assessment Tax Assessment Total Assessment is a certain percentage of the fair market value that is determined by local assessors to be the total taxable value of land and additions on the property. | Land | Improvement |
|---|---|---|---|---|
| 2024 | $8,518 | $116,883 | $26,715 | $90,168 |
| 2023 | $8,081 | $104,537 | $23,893 | $80,644 |
| 2022 | $8,327 | $103,097 | $22,344 | $80,753 |
| 2021 | $7,990 | $96,047 | $20,816 | $75,231 |
| 2020 | $7,780 | $92,647 | $20,079 | $72,568 |
| 2019 | $7,591 | $88,674 | $19,218 | $69,456 |
| 2018 | $7,162 | $81,916 | $17,753 | $64,163 |
| 2017 | $7,014 | $77,170 | $16,724 | $60,446 |
| 2016 | $6,908 | $72,379 | $15,686 | $56,693 |
| 2013 | -- | $65,184 | $14,632 | $50,552 |
Source: Public Records
Map
Nearby Homes
- 1157 Sawmill Ln
- 2380 Dawson Ln Unit 165
- 760 Regal Ln
- 681 Majestic Dr
- 1820 Crofton Dr
- 2051 Carlisle St
- 1920 Jester Ln
- 1002 Interloch Ct Unit 152
- 700 Fairfield Ln
- 20 Peach Tree Ct Unit 4153
- 18 Peach Tree Ct Unit 4154
- 2069 Peach Tree Ln Unit 4116
- 145 S Oakleaf Rd
- 895 Eineke Blvd
- 601 Woods Creek Ln
- 1900 Waverly Ln
- 2660 Harnish Dr
- 7 Falcon Ridge Ct
- 2612 Loren Ln Unit 293
- 1 N Hubbard St
- 1141 Dawson Ln
- 1161 Dawson Ln
- 1160 Millcreek Ln
- 1170 Millcreek Ln
- 1150 Millcreek Ln
- 1131 Dawson Ln
- 1134 Sawmill Ln
- 1132 Sawmill Ln
- 1140 Dawson Ln
- 1130 Dawson Ln
- 1180 Millcreek Ln
- 1140 Millcreek Ln
- 1150 Dawson Ln
- 1121 Dawson Ln
- 1120 Dawson Ln
- 1136 Sawmill Ln
- 1130 Millcreek Ln
- 1190 Millcreek Ln
- 1111 Dawson Ln
- 1110 Dawson Ln
Your Personal Tour Guide
Ask me questions while you tour the home.