NOT LISTED FOR SALE

1151 N Main St Fremont, NE 68025

Estimated Value: $215,000 - $338,395

4 Beds
6 Baths
1,256 Sq Ft
$199/Sq Ft Est. Value

Last Sold July 02, 2021

Last sale price $312,500 $249 Per Sq Ft

Est. 20% decrease in value since last sale

Current estimated payment $1,591/month

Highlights

  • 2 Fireplaces
  • 4 Car Attached Garage
  • Forced Air Heating and Cooling System
  • No HOA
  • Ceiling height of 9 feet or more
  • 3-minute walk to Izaak Walton Park

About This Home

As of July 2021

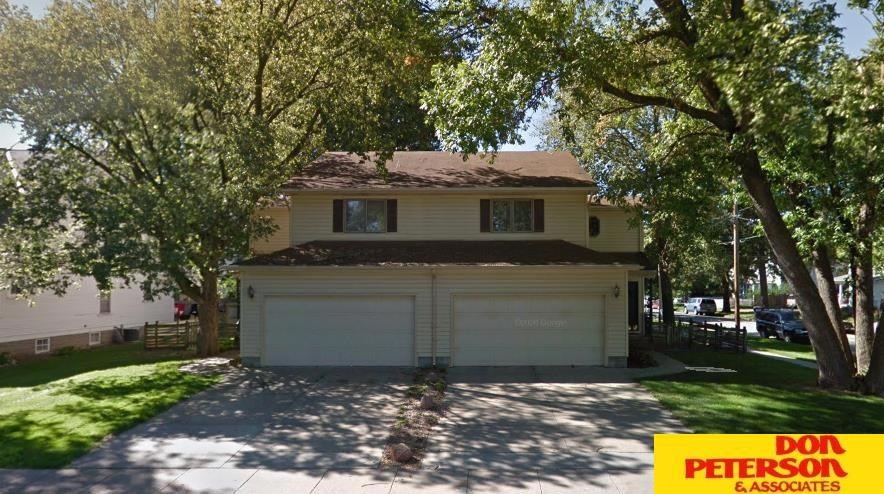
Well maintained townhouses centrally located in Fremont. Both units are 2 bed, 3 bath with an attached 2-car garage and feature main floor laundry, a fully fenced in backyard with patio and retractable awning and a HUGE master bedroom. Don't miss the opportunity to own a great set of townhomes!

Last Agent to Sell the Property

Maggie Hiatt

Don Peterson & Associates R E Brokerage Phone: 402-949-0769 License #20230185 Listed on: 05/24/2021

Last Buyer's Agent

Marlin Brabec

Don Peterson & Associates R E License #0873829

Property Details

Home Type

  • Multi-Family

Est. Annual Taxes

  • $5,765

Year Built

  • Built in 1994

Lot Details

  • 8,316 Sq Ft Lot
  • Property is Fully Fenced
  • Wood Fence

Parking

  • 4 Car Attached Garage

Home Design

  • Block Foundation
  • Composition Roof

Interior Spaces

  • Ceiling height of 9 feet or more
  • 2 Fireplaces
  • Basement

Bedrooms and Bathrooms

  • 4 Bedrooms

Schools

  • Bell Field Elementary School
  • Fremont Middle School
  • Fremont High School

Utilities

  • Forced Air Heating and Cooling System
  • Heating System Uses Gas

Community Details

  • No Home Owners Association
  • 2 Units

Listing and Financial Details

  • Total Actual Rent $700
  • Assessor Parcel Number 270000287 270000280

Property Details

Home Type

Multi-Family

Est. Annual Taxes

$5,765

Year Built

Built in 1994

Lot Details

0

Parking

4

Listing Details

  • Parcel Number: 270000287 270000280
  • Property Sub Type: Multi Family
  • Year Built: 1994
  • Prop. Type: Residential Income
  • Lot Size Acres: 0.1909
  • Lot Size: 8316
  • Ownership: Fee Simple
  • Directions: Use GPS.
  • Carport Y N: No
  • Garage Yn: Yes
  • New Construction: No
  • ResoBuildingAreaSource: Assessor
  • Attribution Contact: M: 402-949-0769
  • Special Features: None

Interior Features

  • Interior Amenities: 9'+ Ceiling
  • Basement YN: Yes
  • Full Bathrooms: 2
  • Total Bedrooms: 4
  • Fireplaces: 2
  • Fireplace: Yes
  • ResoLivingAreaSource: Assessor

Exterior Features

  • Foundation Details: Block
  • Fencing: Wood, Full
  • Property Condition: Not New and NOT a Model
  • Roof: Composition

Garage/Parking

  • Garage Spaces: 4
  • Attached Garage: Yes
  • Covered Parking Spaces: 4
  • Parking Features: Attached
  • Total Parking Spaces: 4

Utilities

  • Cooling: Central Air
  • Cooling Y N: Yes
  • Heating: Gas, Forced Air
  • Heating Yn: Yes
  • Sewer: Public Sewer
  • Water Source: Public

Condo/Co-op/Association

  • Association: No

Schools

  • High School: Fremont
  • Elementary School: Bell Field
  • Junior High Dist: Fremont
  • Middle Or Junior School: Fremont

Lot Info

  • Lot Features: Up to 1/4 Acre.
  • Lot Size Sq Ft: 8316
  • ResoLotSizeUnits: SquareFeet

Tax Info

  • Tax Year: 2020
  • Tax Annual Amount: 5765.18

Multi Family

  • Number Of Units Total: 2
  • Total Actual Rent: 700

Ownership History

Date Name Owned For Owner Type

Purchase Details

Closed on
Jul 10, 2008
Total Days on Market
0
Current Estimated Value
$249,349
Source: Public Records

Range of Values:

Collateral Analytics

Collateral Analytics Collateral Analytics AVMs (Automated Valuation Model) employ a number of statistical approaches combined with neighborhood-specific comparable selection guarantees the most up-to-date and precise valuations.

Not Available

Collateral Analytics does not have data for the current month. Please view the chart for historical values.

ICE

ICE Mortgage Technology ICE Mortgage Technology’s AVM (Automated Valuation Model) is a state-of-the-art online residential property valuation tool that provides a quick and accurate estimate of the value of almost any home in the U.S.

Not Available

ICE Mortgage Technology does not have data for the current month. Please view the chart for historical values.

First American

First American First American Data & Analytics’ next-generation AVM combines unrivaled data assets with a blended ensemble of valuation models to produce highly accurate, reliable valuations you can trust.

Not Available

First American does not have data for the current month. Please view the chart for historical values.

Quantarium

Quantarium Quantarium’s valuation service, repeatedly proven the industry’s most accurate and comprehensive, is supercharged with a self-learning and auto-tuning AI engine that continually becomes smarter and more accurate as it processes daily inputs from the industry’s leading RE data lake.

Not Available

Quantarium does not have data for the current month. Please view the chart for historical values.

Average Value
Not Available
List Price
Sold Price
Create a Home Valuation Report for This Property
The Home Valuation Report is an in-depth analysis detailing your home's value as well as a comparison with similar homes in the area

Home Values in the Area

Source: Public Records

Average Home Value in this Area


Source: Public Records

Purchase History

Date Buyer Sale Price Title Company
-- -- --
Source: Public Records

Property History

Date Event Price Change Sq Ft Price
07/02/2021 07/02/21 Sold $312,500 +11.6% $249 / Sq Ft
05/24/2021 05/24/21 Pending -- -- --
05/24/2021 05/24/21 For Sale $280,000 -- $223 / Sq Ft
Source: Great Plains Regional MLS

Tax History Compared to Growth

Source: Public Records

Tax History

Year Tax Paid Tax Assessment Tax Assessment Total Assessment is a certain percentage of the fair market value that is determined by local assessors to be the total taxable value of land and additions on the property. Land Improvement
2024 $2,301 $193,024 $16,236 $176,788
2023 $3,078 $182,250 $14,207 $168,043
2022 $3,428 $191,653 $12,177 $179,476
2021 $3,076 $169,278 $9,744 $159,534
2020 $2,879 $156,582 $9,013 $147,569
2019 $2,878 $148,118 $8,526 $139,592
2018 $2,819 $141,065 $8,120 $132,945
2017 $2,551 $130,610 $8,120 $122,490
2016 $26 $126,105 $8,120 $117,985
2015 $2,361 $126,105 $8,120 $117,985
2012 -- $126,695 $8,200 $118,495
Source: Public Records

Agents Affiliated with this Home

  • Section Image
  • Section Image
See All Agents

Map

Source: Great Plains Regional MLS

MLS Number: 22111160

Great Plains Regional MLS

APN: 270000287