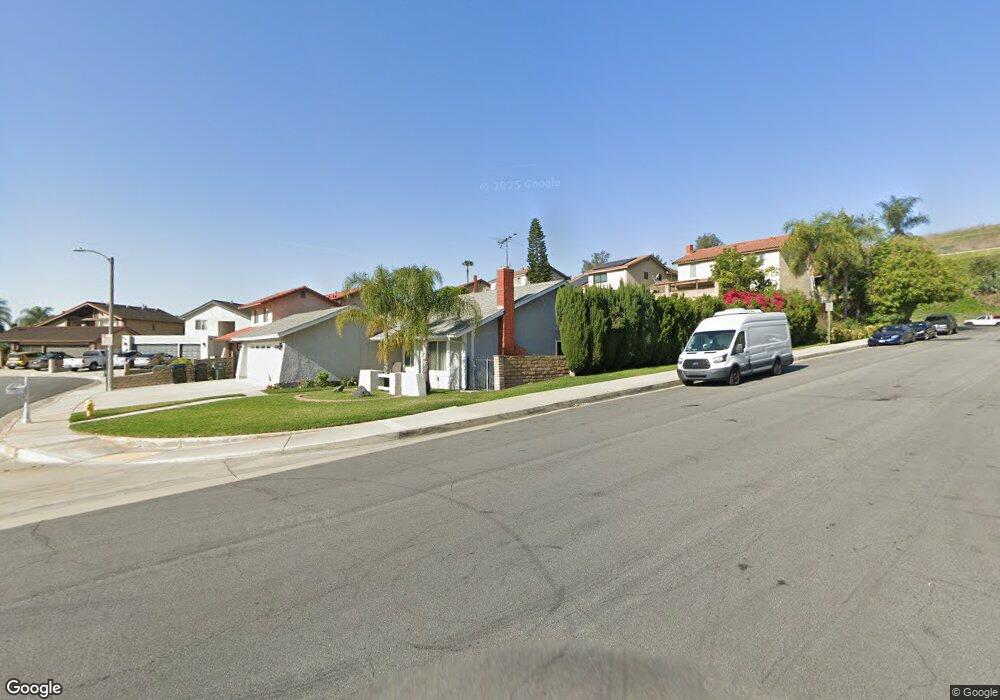
1151 N Villa St Montebello, CA 90640
Estimated Value: $935,188 - $1,020,000
3
Beds
2
Baths
1,701
Sq Ft
$569/Sq Ft
Est. Value
About This Home
This home is located at 1151 N Villa St, Montebello, CA 90640 and is currently estimated at $967,547, approximately $568 per square foot. 1151 N Villa St is a home located in Los Angeles County with nearby schools including La Merced Elementary School, La Merced Intermediate School, and Montebello High School.
Ownership History
Date
Name
Owned For
Owner Type
Purchase Details
Closed on
Jun 6, 2004
Sold by
Rodriguez Anthony L and Rodriguez Elke M
Bought by
Rodriguez Anthony L and Rodriguez Elke M
Current Estimated Value
Purchase Details
Closed on
Mar 20, 2001
Sold by
Farias Jaime
Bought by
Rodriguez Anthony and Rodriguez Elke
Home Financials for this Owner
Home Financials are based on the most recent Mortgage that was taken out on this home.
Original Mortgage
$215,200
Outstanding Balance
$78,067
Interest Rate
6.97%
Estimated Equity
$889,480
Purchase Details
Closed on
Nov 8, 1994
Sold by
Farias Myrna Guadalupe
Bought by
Farias Jaime
Home Financials for this Owner
Home Financials are based on the most recent Mortgage that was taken out on this home.
Original Mortgage
$142,800
Interest Rate
4.62%
Purchase Details
Closed on
Nov 7, 1994
Sold by
Cafa Investments Lp
Bought by
Farias Jaime
Home Financials for this Owner
Home Financials are based on the most recent Mortgage that was taken out on this home.
Original Mortgage
$142,800
Interest Rate
4.62%
Create a Home Valuation Report for This Property
The Home Valuation Report is an in-depth analysis detailing your home's value as well as a comparison with similar homes in the area
Home Values in the Area
Average Home Value in this Area
Purchase History
| Date | Buyer | Sale Price | Title Company |
|---|---|---|---|
| Rodriguez Anthony L | -- | -- | |
| Rodriguez Anthony L | -- | -- | |
| Rodriguez Anthony | $269,000 | Orange Coast Title | |
| Farias Jaime | -- | Investors Title Company | |
| Farias Jaime | -- | Investors Title Company |
Source: Public Records
Mortgage History
| Date | Status | Borrower | Loan Amount |
|---|---|---|---|
| Open | Rodriguez Anthony | $215,200 | |
| Previous Owner | Farias Jaime | $142,800 | |
| Closed | Rodriguez Anthony | $26,900 |
Source: Public Records
Tax History Compared to Growth
Tax History
| Year | Tax Paid | Tax Assessment Tax Assessment Total Assessment is a certain percentage of the fair market value that is determined by local assessors to be the total taxable value of land and additions on the property. | Land | Improvement |
|---|---|---|---|---|
| 2025 | $6,176 | $405,320 | $251,481 | $153,839 |
| 2024 | $6,176 | $397,373 | $246,550 | $150,823 |
| 2023 | $6,154 | $389,582 | $241,716 | $147,866 |
| 2022 | $5,948 | $381,944 | $236,977 | $144,967 |
| 2021 | $5,736 | $374,456 | $232,331 | $142,125 |
| 2019 | $5,483 | $363,351 | $225,441 | $137,910 |
| 2018 | $5,487 | $356,227 | $221,021 | $135,206 |
| 2016 | $5,249 | $342,396 | $212,440 | $129,956 |
| 2015 | $4,975 | $337,253 | $209,249 | $128,004 |
| 2014 | $4,911 | $330,648 | $205,151 | $125,497 |
Source: Public Records
Map
Nearby Homes
- 929 W Ashiya Rd
- 228 Mullberry Place
- 1018 W Yorktown Ave
- 378 Mullberry Place
- 48 Primrose Ct
- 1155 Poppy Ct
- 211 Peacock Ln
- 1108 Poppy Ct
- 1198 Poppy Ct
- 105 Remy Ln
- 25 Remy Ln
- 15 Remy Ln
- 55 Remy Ln
- Apex Plan at Metro Heights - Viewpoint
- Spectrum Plan at Metro Heights - Viewpoint
- 1012 Burke Dr
- 737 N 4th St
- 861 Marconi St
- 108 Verbena Way
- 58 Remy Ln
- 1147 N Villa St
- 1148 N Iguala St
- 1144 N Iguala St
- 904 W Liberty Ave
- 1143 N Villa St
- 900 W Liberty Ave
- 820 W Boston Ave
- 908 W Liberty Ave
- 912 W Liberty Ave
- 827 W Boston Ave
- 916 W Liberty Ave
- 836 W Liberty Ave
- 920 W Liberty Ave
- 816 W Boston Ave
- 823 W Boston Ave
- 1136 N Iguala St
- 1209 N Villa St
- 832 W Liberty Ave
- 819 W Boston Ave
- 924 W Liberty Ave