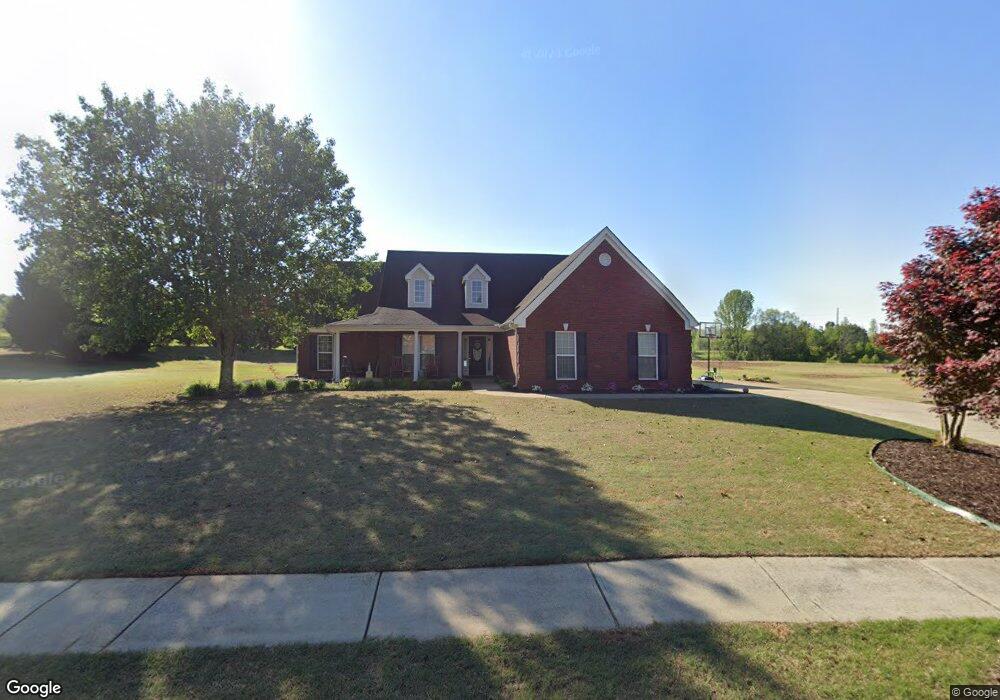
1151 Ruby Way Bogart, GA 30622
Estimated Value: $460,264 - $476,000
3
Beds
2
Baths
2,105
Sq Ft
$223/Sq Ft
Est. Value
About This Home
This home is located at 1151 Ruby Way, Bogart, GA 30622 and is currently estimated at $470,066, approximately $223 per square foot. 1151 Ruby Way is a home located in Oconee County with nearby schools including Rocky Branch Elementary School, Malcom Bridge Middle School, and North Oconee High School.
Ownership History
Date
Name
Owned For
Owner Type
Purchase Details
Closed on
Oct 20, 2008
Sold by
Not Provided
Bought by
Smith Jonathan R and Smith Andrea L
Current Estimated Value
Home Financials for this Owner
Home Financials are based on the most recent Mortgage that was taken out on this home.
Original Mortgage
$197,448
Outstanding Balance
$125,493
Interest Rate
5.78%
Mortgage Type
FHA
Estimated Equity
$344,573
Purchase Details
Closed on
Aug 5, 2008
Sold by
Kilgore Dawn C and Jackson B.
Bought by
Residential Funding Corp
Purchase Details
Closed on
Aug 11, 2005
Sold by
Star Home Builders Inc
Bought by
Kilgore Jackson B and Kilgore Dawn C
Home Financials for this Owner
Home Financials are based on the most recent Mortgage that was taken out on this home.
Original Mortgage
$191,805
Interest Rate
7.45%
Mortgage Type
New Conventional
Purchase Details
Closed on
Mar 24, 2004
Sold by
Diamonds & Pearls Land Co Llc
Bought by
Star Home Builders Inc
Create a Home Valuation Report for This Property
The Home Valuation Report is an in-depth analysis detailing your home's value as well as a comparison with similar homes in the area
Purchase History
| Date | Buyer | Sale Price | Title Company |
|---|---|---|---|
| Smith Jonathan R | $199,500 | -- | |
| Smith Jonathan R | $199,500 | -- | |
| Residential Funding Corp | -- | -- | |
| Smith Jonathan R | $197,910 | -- | |
| Kilgore Jackson B | $201,900 | -- | |
| Star Home Builders Inc | $1,087,500 | -- |
Source: Public Records
Mortgage History
| Date | Status | Borrower | Loan Amount |
|---|---|---|---|
| Open | Smith Jonathan R | $197,448 | |
| Previous Owner | Kilgore Jackson B | $191,805 |
Source: Public Records
Tax History
| Year | Tax Paid | Tax Assessment Tax Assessment Total Assessment is a certain percentage of the fair market value that is determined by local assessors to be the total taxable value of land and additions on the property. | Land | Improvement |
|---|---|---|---|---|
| 2025 | $2,987 | $168,884 | $36,000 | $132,884 |
| 2024 | $2,987 | $162,350 | $36,000 | $126,350 |
| 2023 | $3,037 | $149,354 | $30,000 | $119,354 |
| 2022 | $2,766 | $129,024 | $26,000 | $103,024 |
| 2021 | $2,510 | $108,638 | $16,000 | $92,638 |
| 2020 | $2,374 | $102,638 | $16,000 | $86,638 |
| 2019 | $2,245 | $97,072 | $16,000 | $81,072 |
| 2018 | $1,971 | $83,488 | $16,000 | $67,488 |
| 2017 | $1,912 | $80,977 | $16,000 | $64,977 |
| 2016 | $1,788 | $75,768 | $15,200 | $60,568 |
| 2015 | $1,638 | $69,288 | $15,200 | $54,088 |
| 2014 | $1,700 | $70,321 | $16,000 | $54,321 |
| 2013 | -- | $67,925 | $16,000 | $51,925 |
Source: Public Records
Map
Nearby Homes
- 1090 Talus St
- 1090 Ruby Way
- 4100 Monroe Hwy
- 4400 Monroe Hwy Unit PARCEL 1-7
- 1181 Pete Dickens Rd
- 1030 Diamond Way
- 1000 Holcomb Ct
- 3240 Monroe Hwy
- 1061 Cobblestone Ln
- 1060 Cobblestone Ln
- 1190 Cobblestone Ln
- 00 Ruth Jackson Rd
- 0 Ruth Jackson Rd Unit 10582108
- 1542 Lenten Way
- 1640 Madison Ct
- 2986 Coralbell Dr
- 2142 Eisenhower Ave
- 1450 Lincoln Dr
- 1060 Fox Hollow Ct
- 1811 McNutt Creek Rd
- 1151 Ruby Way Unit 4B
- 1161 Ruby Way Unit 5B
- 1161 Ruby Way
- 1141 Ruby Way Unit 3B
- 1141 Ruby Way
- 1221 Diamond Way Unit 1D
- 1221 Diamond Way
- 1170 Ruby Way Unit 10B
- 1170 Ruby Way
- 1131 Ruby Way Unit 2B
- 1131 Ruby Way
- 1140 Ruby Way
- 1181 Ruby Way Unit 6B
- 1181 Ruby Way
- 1040 Talus St
- 1130 Ruby Way Unit 3D
- 1130 Ruby Way
- 1020 Talus St Unit 1B
- 1020 Talus St
- 1190 Ruby Way Unit 9B
Your Personal Tour Guide
Ask me questions while you tour the home.