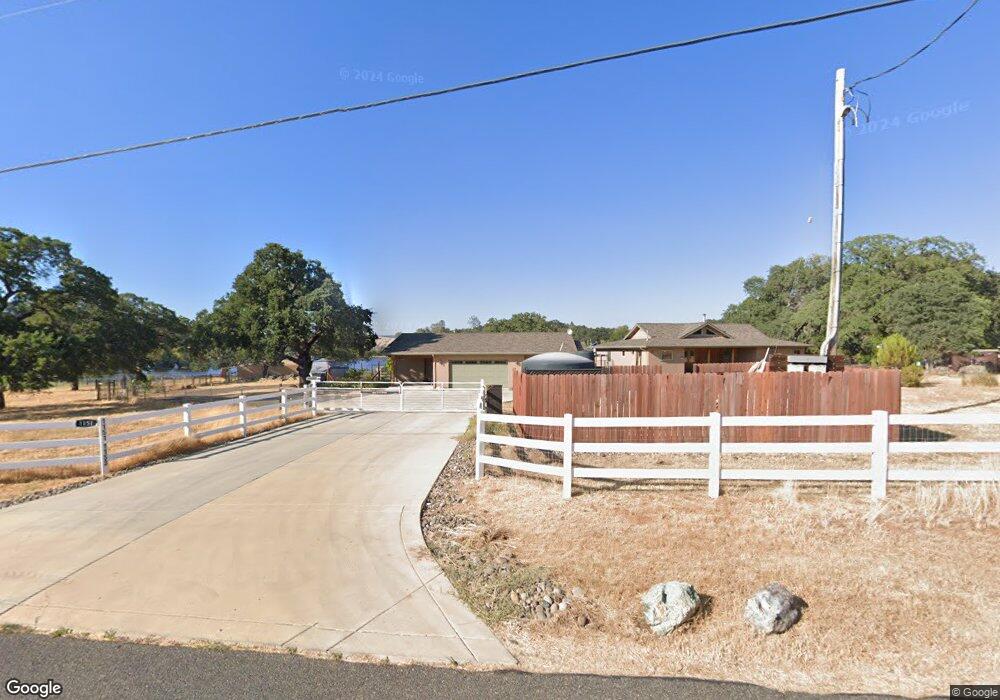
1151 Shoreline Dr Placerville, CA 95667
Estimated Value: $526,000 - $719,575
2
Beds
2
Baths
--
Sq Ft
5
Acres
About This Home
This home is located at 1151 Shoreline Dr, Placerville, CA 95667 and is currently estimated at $610,192. 1151 Shoreline Dr is a home located in El Dorado County with nearby schools including Sutter's Mill Elementary School, Gold Trail School, and El Dorado High School.
Ownership History
Date
Name
Owned For
Owner Type
Purchase Details
Closed on
Jun 22, 2011
Sold by
Paye Mark C and Paye James D
Bought by
Matin E Joyce E and Matin Suzanne Elaine
Current Estimated Value
Purchase Details
Closed on
Jun 2, 2009
Sold by
Paye James D and Paye Judith E
Bought by
Paye James D and Paye Judith E
Purchase Details
Closed on
Dec 19, 2008
Sold by
Schlitz Terri L
Bought by
Paye Mark C and Paye James D
Purchase Details
Closed on
Apr 27, 1999
Sold by
The Koop Trust
Bought by
Schlitz Terri L
Home Financials for this Owner
Home Financials are based on the most recent Mortgage that was taken out on this home.
Original Mortgage
$63,750
Interest Rate
8.25%
Mortgage Type
Balloon
Purchase Details
Closed on
Oct 15, 1998
Sold by
Peter Koop
Bought by
The Koop Trust
Create a Home Valuation Report for This Property
The Home Valuation Report is an in-depth analysis detailing your home's value as well as a comparison with similar homes in the area
Home Values in the Area
Average Home Value in this Area
Purchase History
| Date | Buyer | Sale Price | Title Company |
|---|---|---|---|
| Matin E Joyce E | $110,000 | Inter County Title Co | |
| Paye James D | -- | None Available | |
| Paye Mark C | $261,513 | First American Title Ins Co | |
| Schlitz Terri L | $85,000 | Fidelity National Title Co | |
| The Koop Trust | -- | -- |
Source: Public Records
Mortgage History
| Date | Status | Borrower | Loan Amount |
|---|---|---|---|
| Previous Owner | Schlitz Terri L | $63,750 |
Source: Public Records
Tax History Compared to Growth
Tax History
| Year | Tax Paid | Tax Assessment Tax Assessment Total Assessment is a certain percentage of the fair market value that is determined by local assessors to be the total taxable value of land and additions on the property. | Land | Improvement |
|---|---|---|---|---|
| 2025 | $5,212 | $471,895 | $140,920 | $330,975 |
| 2024 | $5,212 | $462,643 | $138,157 | $324,486 |
| 2023 | $5,114 | $453,573 | $135,449 | $318,124 |
| 2022 | $5,043 | $444,681 | $132,794 | $311,887 |
| 2021 | $4,978 | $435,963 | $130,191 | $305,772 |
| 2020 | $4,914 | $431,494 | $128,857 | $302,637 |
| 2019 | $4,844 | $423,034 | $126,331 | $296,703 |
| 2018 | $4,716 | $414,740 | $123,854 | $290,886 |
| 2017 | $4,640 | $406,609 | $121,426 | $285,183 |
| 2016 | $4,575 | $398,638 | $119,046 | $279,592 |
| 2015 | $4,432 | $392,652 | $117,258 | $275,394 |
| 2014 | $4,432 | $384,962 | $114,962 | $270,000 |
Source: Public Records
Map
Nearby Homes
- 1363 Crooked Mile Ct
- 5105 Glory View Dr
- 5050 Glory View Dr
- 4740 Glory View Dr
- 000 Bakers Mountain Rd
- 4644 Bakers Mountain Rd
- 5144 Bassi Rd
- 4221 Flapjack Ct
- 994 Lotus Rd
- 5880 Heavens Gate
- 4540 Meadow Creek Rd
- 7151 Beach View Dr
- 0 Rossler Rd
- 6400 State Highway 49
- 4890 Thompson Hill Rd
- 4950 Thompson Hill Rd
- 1285 Sierra Ct E
- 1700 Shadydale Ln
- 1720 Pleasant Ranch Ct
- 5661 Thompson Hill Rd
- 1135 Shoreline Dr
- 1167 Shoreline Dr
- 1150 Shoreline Dr
- 1173 Shoreline Dr
- 1181 Shoreline Dr
- 1240 Crooked Mile Ct
- 1120 Trails End Dr
- 1120 Shoreline Dr
- 1030 Shoreline Dr
- 1078 Shoreline Dr
- 1191 Shoreline Dr
- 1108 Shoreline Dr
- 1110 Trails End Dr
- 1176 Large Oak Dr
- 1180 Large Oak Dr
- 1086 Shoreline Dr
- 1081 Shoreline Dr
- 1190 Large Oak Dr
- 1057 Shoreline Dr
- 0 Whistling Wind Way