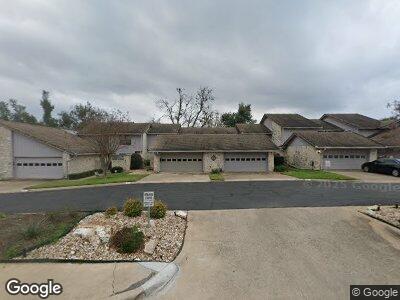
11512 Tin Cup Dr Unit 110 Austin, TX 78750
Bull Creek NeighborhoodEstimated Value: $456,444 - $497,000
3
Beds
3
Baths
2,149
Sq Ft
$222/Sq Ft
Est. Value
About This Home
This home is located at 11512 Tin Cup Dr Unit 110, Austin, TX 78750 and is currently estimated at $476,722, approximately $221 per square foot. 11512 Tin Cup Dr Unit 110 is a home located in Travis County with nearby schools including Spicewood Elementary School, Canyon Vista Middle, and Westwood High School.
Ownership History
Date
Name
Owned For
Owner Type
Purchase Details
Closed on
Aug 15, 2022
Sold by
Andrew Jackson
Bought by
Andrew W Jackson Revocable Living Trust
Current Estimated Value
Purchase Details
Closed on
May 28, 2008
Sold by
Kubena Ronald A and Kubena Kimberle Y
Bought by
Jackson Andrew
Home Financials for this Owner
Home Financials are based on the most recent Mortgage that was taken out on this home.
Original Mortgage
$184,800
Interest Rate
5.89%
Mortgage Type
Purchase Money Mortgage
Purchase Details
Closed on
Feb 13, 2008
Sold by
Dowd Robert and Dowd Stacey J
Bought by
Kubena Ronald A and Kubena Kimberle Y
Home Financials for this Owner
Home Financials are based on the most recent Mortgage that was taken out on this home.
Original Mortgage
$202,500
Interest Rate
5.88%
Mortgage Type
Purchase Money Mortgage
Create a Home Valuation Report for This Property
The Home Valuation Report is an in-depth analysis detailing your home's value as well as a comparison with similar homes in the area
Home Values in the Area
Average Home Value in this Area
Purchase History
| Date | Buyer | Sale Price | Title Company |
|---|---|---|---|
| Andrew W Jackson Revocable Living Trust | -- | None Listed On Document | |
| Jackson Andrew | -- | Atc | |
| Kubena Ronald A | -- | Itc |
Source: Public Records
Mortgage History
| Date | Status | Borrower | Loan Amount |
|---|---|---|---|
| Previous Owner | Jackson Andrew | $20,000 | |
| Previous Owner | Jackson Andrew | $208,500 | |
| Previous Owner | Jackson Andrew | $184,800 | |
| Previous Owner | Kubena Ronald A | $202,500 |
Source: Public Records
Tax History Compared to Growth
Tax History
| Year | Tax Paid | Tax Assessment Tax Assessment Total Assessment is a certain percentage of the fair market value that is determined by local assessors to be the total taxable value of land and additions on the property. | Land | Improvement |
|---|---|---|---|---|
| 2023 | $5,697 | $389,825 | $24,372 | $365,453 |
| 2022 | $7,619 | $373,331 | $24,372 | $348,959 |
| 2021 | $7,919 | $352,179 | $24,372 | $333,721 |
| 2020 | $7,228 | $320,163 | $24,372 | $325,654 |
| 2018 | $6,157 | $264,597 | $24,372 | $322,361 |
| 2017 | $5,702 | $240,543 | $24,372 | $308,324 |
| 2016 | $5,184 | $218,675 | $24,372 | $308,324 |
| 2015 | $4,513 | $198,795 | $24,372 | $174,423 |
| 2014 | $4,513 | $198,352 | $24,372 | $173,980 |
Source: Public Records
Map
Nearby Homes
- 11512 Tin Cup Dr Unit 211
- 11558 Spicewood Pkwy Unit 7
- 11310 Spicewood Club Dr Unit Y
- 11310 Spicewood Club Dr Unit 10
- 11532 Spicewood Pkwy
- 11311 Pickfair Dr
- 11608 Spicewood Pkwy Unit 38
- 11402 Pencewood Dr
- 10400 Burmaster Ln Unit A
- 10400 Burmaster Ln
- 11208 Taterwood Dr
- 11605 Gunsmoke Cir
- 11203 Pencewood Dr
- 11903 Swan Dr
- 11408 Spicewood Pkwy
- 11906 Arch Hill Dr
- 11910 Nene Dr
- 10416 Doering Ln
- 10900 Plumewood Dr
- 9401 Cedar Crest Dr
- 11512 Tin Cup Dr Unit 112
- 11512 Tin Cup Dr
- 11512 Tin Cup Dr Unit 100
- 11512 Tin Cup Dr Unit 101
- 11512 Tin Cup Dr Unit 102
- 11512 Tin Cup Dr Unit 103
- 11512 Tin Cup Dr Unit 104
- 11512 Tin Cup Dr Unit 105
- 11512 Tin Cup Dr Unit 106
- 11512 Tin Cup Dr Unit 107
- 11512 Tin Cup Dr Unit 108
- 11512 Tin Cup Dr Unit 109
- 11512 Tin Cup Dr Unit 110
- 11512 Tin Cup Dr Unit 111
- 11512 Tin Cup Dr Unit 11200
- 11512 Tin Cup Dr Unit 113
- 11512 Tin Cup Dr Unit 114
- 11512 Tin Cup Dr Unit 207
- 11512 Tin Cup Dr Unit 206
- 11512 Tin Cup Dr Unit 205