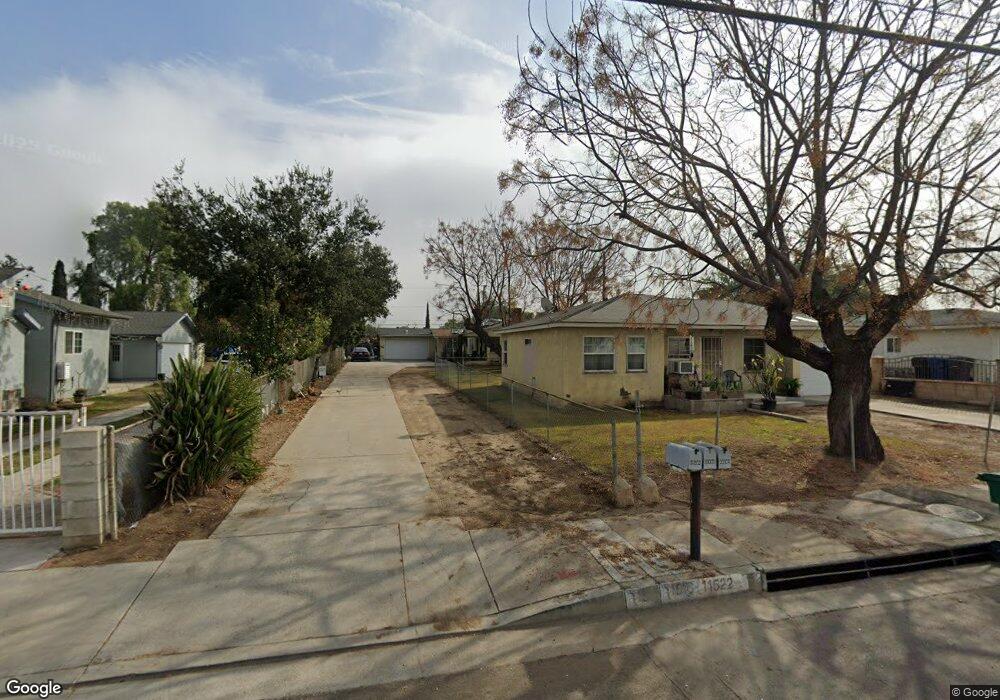
11518 Shoemaker Ave Whittier, CA 90605
South Whittier NeighborhoodEstimated Value: $946,017 - $1,230,000
6
Beds
3
Baths
2,683
Sq Ft
$403/Sq Ft
Est. Value
About This Home
This home is located at 11518 Shoemaker Ave, Whittier, CA 90605 and is currently estimated at $1,081,004, approximately $402 per square foot. 11518 Shoemaker Ave is a home located in Los Angeles County with nearby schools including California High School and St. Gregory The Great.
Ownership History
Date
Name
Owned For
Owner Type
Purchase Details
Closed on
Aug 25, 2005
Sold by
Vest Steven M
Bought by
Vest Steven M and Vest Donald Allan
Current Estimated Value
Home Financials for this Owner
Home Financials are based on the most recent Mortgage that was taken out on this home.
Original Mortgage
$450,000
Outstanding Balance
$243,016
Interest Rate
6%
Mortgage Type
Purchase Money Mortgage
Estimated Equity
$837,988
Purchase Details
Closed on
Apr 1, 1999
Sold by
Vest Donald A and Vest Elizabeth
Bought by
Vest Steven M
Home Financials for this Owner
Home Financials are based on the most recent Mortgage that was taken out on this home.
Original Mortgage
$230,880
Interest Rate
6.92%
Mortgage Type
FHA
Purchase Details
Closed on
Dec 23, 1994
Sold by
Dixon Kennett George and Dixon Arline Helen
Bought by
Vest Steven M and Vest Donna M
Home Financials for this Owner
Home Financials are based on the most recent Mortgage that was taken out on this home.
Original Mortgage
$189,600
Interest Rate
9.29%
Create a Home Valuation Report for This Property
The Home Valuation Report is an in-depth analysis detailing your home's value as well as a comparison with similar homes in the area
Home Values in the Area
Average Home Value in this Area
Purchase History
| Date | Buyer | Sale Price | Title Company |
|---|---|---|---|
| Vest Steven M | -- | Fidelity National Title Co | |
| Vest Donald Allan | -- | Fidelity National Title Co | |
| Vest Steven M | -- | -- | |
| Vest Steven M | -- | Benefit Land Title | |
| Vest Steven M | -- | Benefit Land Title | |
| Vest Steven M | $237,000 | Gateway Title Company |
Source: Public Records
Mortgage History
| Date | Status | Borrower | Loan Amount |
|---|---|---|---|
| Open | Vest Steven M | $450,000 | |
| Previous Owner | Vest Steven M | $230,880 | |
| Previous Owner | Vest Steven M | $189,600 | |
| Closed | Vest Steven M | $23,700 |
Source: Public Records
Tax History
| Year | Tax Paid | Tax Assessment Tax Assessment Total Assessment is a certain percentage of the fair market value that is determined by local assessors to be the total taxable value of land and additions on the property. | Land | Improvement |
|---|---|---|---|---|
| 2025 | $6,176 | $414,573 | $316,887 | $97,686 |
| 2024 | $6,176 | $406,445 | $310,674 | $95,771 |
| 2023 | $5,754 | $398,477 | $304,583 | $93,894 |
| 2022 | $5,784 | $390,664 | $298,611 | $92,053 |
| 2021 | $5,666 | $383,005 | $292,756 | $90,249 |
| 2020 | $5,611 | $379,079 | $289,755 | $89,324 |
| 2019 | $5,574 | $371,647 | $284,074 | $87,573 |
| 2018 | $5,207 | $364,360 | $278,504 | $85,856 |
| 2016 | $4,946 | $350,214 | $267,691 | $82,523 |
| 2015 | $4,830 | $344,955 | $263,671 | $81,284 |
| 2014 | $4,802 | $338,199 | $258,507 | $79,692 |
Source: Public Records
Map
Nearby Homes
- 13016 Rainier Ave
- 11508 Fidel Ave
- 11514 Fidel Ave
- 11510 Fidel Ave
- 11516 Fidel Ave
- 11904 Painter Ave
- 13118 Sunshine Ave
- 11235 Mina Ave
- 12403 Laurel Ave
- 13450 Meyer Rd Unit 33
- 13470 Meyer Rd Unit 22
- 11902 Leland Ave
- 11229 Alclad Ave
- 11914 Hastings Dr
- 13603 Placid Dr
- 12927 Lariat Ln
- 12915 Lariat Ln
- 12912 Indian Ln Unit 74
- 12930 Joshua Ln
- 12415 Imperial Hwy Unit 38
- 11526 Shoemaker Ave
- 11512 Shoemaker Ave
- 11508 Shoemaker Ave
- 11602 Shoemaker Ave
- 11509 Painter Ave
- 11521 Painter Ave
- 11610 Shoemaker Ave
- 11428 Shoemaker Ave
- 11511 Painter Ave
- 11519 Painter Ave
- 11527 Painter Ave
- 11501 Painter Ave
- 11616 Shoemaker Ave
- 11605 Painter Ave
- 11615 Painter Ave
- 11418 Shoemaker Ave
- 11517 Painter Ave
- 11613 Painter Ave
- 11513 Painter Ave
- 11624 Shoemaker Ave
Your Personal Tour Guide
Ask me questions while you tour the home.