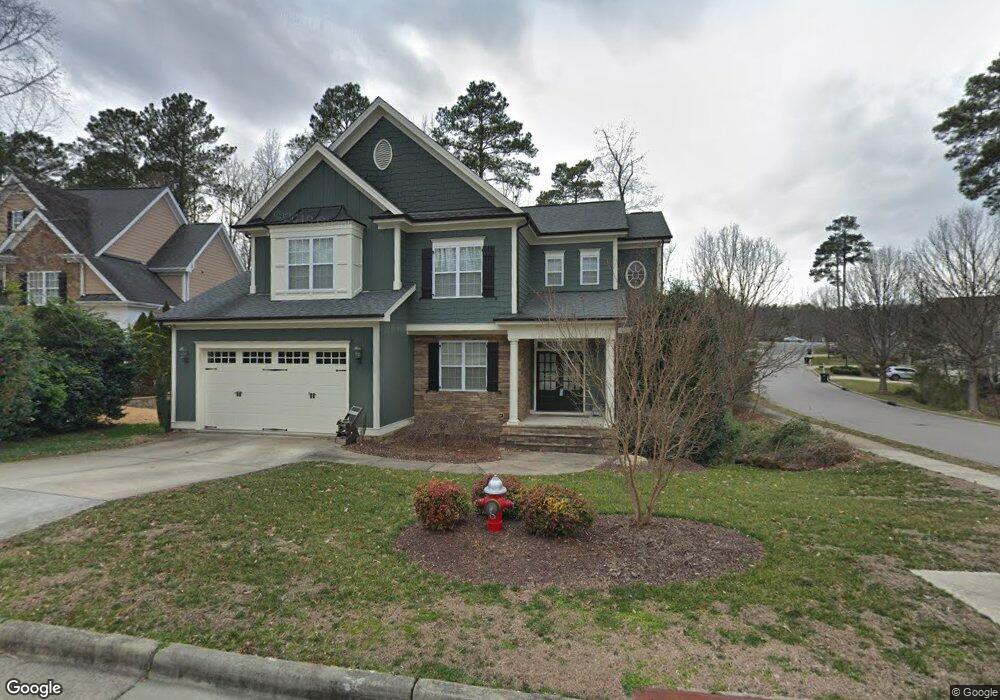
11519 Autumn Oaks Ln Raleigh, NC 27614
Estimated Value: $724,000 - $765,000
5
Beds
5
Baths
3,376
Sq Ft
$219/Sq Ft
Est. Value
About This Home
This home is located at 11519 Autumn Oaks Ln, Raleigh, NC 27614 and is currently estimated at $738,169, approximately $218 per square foot. 11519 Autumn Oaks Ln is a home located in Wake County with nearby schools including Brassfield Elementary School, Wakefield Middle, and Wakefield High School.
Ownership History
Date
Name
Owned For
Owner Type
Purchase Details
Closed on
Jul 2, 2020
Sold by
Arthur Anthony B and Kim Haejin
Bought by
Mckay Jarin and Mckay Brielle
Current Estimated Value
Home Financials for this Owner
Home Financials are based on the most recent Mortgage that was taken out on this home.
Original Mortgage
$353,000
Outstanding Balance
$310,711
Interest Rate
3.1%
Mortgage Type
New Conventional
Estimated Equity
$427,458
Purchase Details
Closed on
Mar 19, 2010
Sold by
Arthur Sukchong S
Bought by
Arthur Anthony B
Purchase Details
Closed on
May 10, 2006
Sold by
Homes By Dickerson Inc
Bought by
Arthur Anthony B and Arthur Sukchong S
Home Financials for this Owner
Home Financials are based on the most recent Mortgage that was taken out on this home.
Original Mortgage
$349,200
Interest Rate
6.51%
Mortgage Type
Purchase Money Mortgage
Purchase Details
Closed on
Jun 9, 2005
Sold by
Falls Pointe Llc
Bought by
Homes By Dickerson
Create a Home Valuation Report for This Property
The Home Valuation Report is an in-depth analysis detailing your home's value as well as a comparison with similar homes in the area
Home Values in the Area
Average Home Value in this Area
Purchase History
| Date | Buyer | Sale Price | Title Company |
|---|---|---|---|
| Mckay Jarin | $423,000 | None Available | |
| Arthur Anthony B | -- | None Available | |
| Arthur Anthony B | $436,500 | None Available | |
| Homes By Dickerson | $60,000 | -- |
Source: Public Records
Mortgage History
| Date | Status | Borrower | Loan Amount |
|---|---|---|---|
| Open | Mckay Jarin | $353,000 | |
| Previous Owner | Arthur Anthony B | $349,200 |
Source: Public Records
Tax History Compared to Growth
Tax History
| Year | Tax Paid | Tax Assessment Tax Assessment Total Assessment is a certain percentage of the fair market value that is determined by local assessors to be the total taxable value of land and additions on the property. | Land | Improvement |
|---|---|---|---|---|
| 2025 | $5,470 | $624,973 | $130,000 | $494,973 |
| 2024 | $5,448 | $624,973 | $130,000 | $494,973 |
| 2023 | $4,519 | $412,726 | $80,000 | $332,726 |
| 2022 | $4,199 | $412,726 | $80,000 | $332,726 |
| 2021 | $4,036 | $412,726 | $80,000 | $332,726 |
| 2020 | $3,962 | $412,726 | $80,000 | $332,726 |
| 2019 | $5,092 | $437,641 | $80,000 | $357,641 |
| 2018 | $4,802 | $437,641 | $80,000 | $357,641 |
| 2017 | $4,573 | $437,641 | $80,000 | $357,641 |
| 2016 | $4,479 | $437,641 | $80,000 | $357,641 |
| 2015 | $4,732 | $455,071 | $80,000 | $375,071 |
| 2014 | $4,488 | $455,071 | $80,000 | $375,071 |
Source: Public Records
Map
Nearby Homes
- 9508 Waterwood Ct
- 9531 Waterwood Ct
- 1501 Nealstone Way
- 1711 Happiness Hill Ln
- 12019 Holmes Hollow Rd
- 4113 Falls River Ave
- 2051 Dunn Rd
- 2201 Wide River Dr
- 1505 October Rd
- 4406 Crystal Breeze St
- 4720 All Points View Way
- 10904 Fitzwilliam St
- 10907 Flower Bed Ct
- 1911 Falls Landing Dr Unit 103
- 1911 Falls Landing Dr Unit 106
- 2061 Hopeton Ave
- 1808 Falls Landing Dr
- 1804 Falls Landing Dr
- 1405 October Rd
- 3821 Falls River Ave
- 11515 Autumn Oaks Ln
- 11524 Azari Ct
- 11520 Azari Ct
- 11520 Autumn Oaks Ln
- 11511 Autumn Oaks Ln
- 9328 Tabriz Point
- 9332 Tabriz Point
- 11514 Autumn Oaks Ln
- 11516 Azari Ct
- 9322 Tabriz Point
- 9319 Tabriz Point
- 9338 Tabriz Point
- 1629 High Holly Ln
- 11512 Azari Ct
- 9316 Tabriz Point
- 11502 Azari Ct
- 11500 Autumn Oaks Ln
- 9341 Tabriz Point
- 9341 Tabriz Point Unit Lt.29
- 9315 Tabriz Point