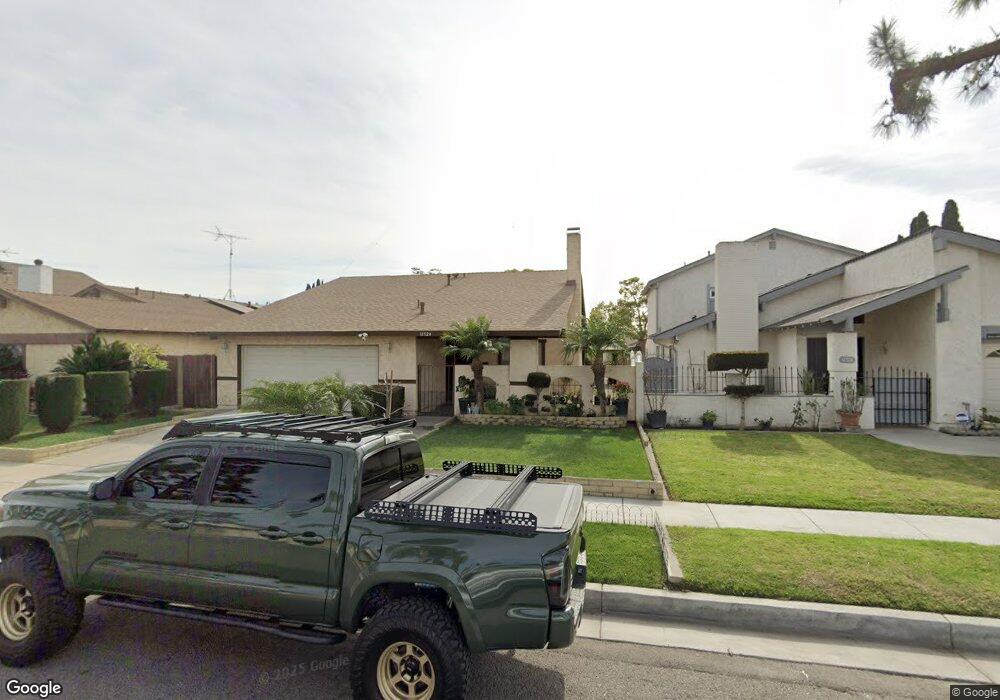
11524 Bos St Cerritos, CA 90703
Estimated Value: $927,464 - $1,070,000
3
Beds
2
Baths
1,248
Sq Ft
$814/Sq Ft
Est. Value
About This Home
This home is located at 11524 Bos St, Cerritos, CA 90703 and is currently estimated at $1,015,366, approximately $813 per square foot. 11524 Bos St is a home located in Los Angeles County with nearby schools including Bragg Elementary School, Haskell Stem Academy, and Gahr High School.
Ownership History
Date
Name
Owned For
Owner Type
Purchase Details
Closed on
Sep 11, 2003
Sold by
Kam Leo Kwai Sum
Bought by
Delos Reyes Armando C and Delos Reyes Maribel
Current Estimated Value
Home Financials for this Owner
Home Financials are based on the most recent Mortgage that was taken out on this home.
Original Mortgage
$302,000
Outstanding Balance
$139,423
Interest Rate
6.17%
Mortgage Type
Purchase Money Mortgage
Estimated Equity
$875,943
Purchase Details
Closed on
Apr 28, 2000
Sold by
Dunwoodie Edward
Bought by
Kam Leo Kwai Sum and Tam Lai Ying
Home Financials for this Owner
Home Financials are based on the most recent Mortgage that was taken out on this home.
Original Mortgage
$205,600
Interest Rate
8.22%
Purchase Details
Closed on
Nov 11, 1999
Sold by
Fernandez Renato D and Fernandez Ester B
Bought by
Dunwoodie Edward
Home Financials for this Owner
Home Financials are based on the most recent Mortgage that was taken out on this home.
Original Mortgage
$213,498
Interest Rate
7.96%
Mortgage Type
FHA
Create a Home Valuation Report for This Property
The Home Valuation Report is an in-depth analysis detailing your home's value as well as a comparison with similar homes in the area
Home Values in the Area
Average Home Value in this Area
Purchase History
| Date | Buyer | Sale Price | Title Company |
|---|---|---|---|
| Delos Reyes Armando C | $403,000 | Chicago Title | |
| Kam Leo Kwai Sum | $257,000 | Chicago Title Co | |
| Dunwoodie Edward | $237,000 | Lawyers Title Company |
Source: Public Records
Mortgage History
| Date | Status | Borrower | Loan Amount |
|---|---|---|---|
| Open | Delos Reyes Armando C | $302,000 | |
| Previous Owner | Kam Leo Kwai Sum | $205,600 | |
| Previous Owner | Dunwoodie Edward | $213,498 |
Source: Public Records
Tax History
| Year | Tax Paid | Tax Assessment Tax Assessment Total Assessment is a certain percentage of the fair market value that is determined by local assessors to be the total taxable value of land and additions on the property. | Land | Improvement |
|---|---|---|---|---|
| 2025 | $6,822 | $572,960 | $431,787 | $141,173 |
| 2024 | $6,822 | $561,726 | $423,321 | $138,405 |
| 2023 | $6,598 | $550,713 | $415,021 | $135,692 |
| 2022 | $6,497 | $539,916 | $406,884 | $133,032 |
| 2021 | $6,345 | $529,330 | $398,906 | $130,424 |
| 2019 | $6,198 | $513,631 | $387,075 | $126,556 |
| 2018 | $5,722 | $503,561 | $379,486 | $124,075 |
| 2016 | $5,497 | $484,009 | $364,751 | $119,258 |
| 2015 | $5,426 | $476,740 | $359,273 | $117,467 |
| 2014 | $5,317 | $467,402 | $352,236 | $115,166 |
Source: Public Records
Map
Nearby Homes
- 19127 Pioneer Blvd Unit 76
- 19127 Pioneer Blvd Unit 9
- 19127 Pioneer Blvd Unit 73
- 19127 Pioneer Blvd Unit 32
- 19127 Pioneer Blvd Unit 30
- 19616 Mapes Ave
- 19741 Sally Ave
- 11702 Christy St
- 11620 187th St
- 20020 Alburtis Ave
- 19202 Benfield Ave
- 11975 Gonsalves St
- 19127 Allingham Ave
- 11003 Bradford Cir
- 12036 Wendy St
- 12133 Candor Dr
- 12143 Phoenix Dr
- 17920 Gard Ave
- 17888 Alburtis Ave
- 20709 Alburtis Ave
- 11518 Bos St
- 11534 Bos St
- 19405 Sheryl Cir
- 19404 Sheryl Cir
- 11508 Bos St
- 19319 Sheryl Ave
- 19411 Sheryl Cir
- 11546 Bos St
- 19410 Sheryl Cir
- 19412 Lusk Ave
- 19417 Sheryl Cir
- 19416 Sheryl Cir
- 11502 Bos St
- 19311 Sheryl Ave
- 19416 Lusk Ave
- 19318 Sheryl Ave
- 19409 Roseton Ave
- 19413 Roseton Ave
- 19403 Roseton Ave
- 19421 Sheryl Cir
Your Personal Tour Guide
Ask me questions while you tour the home.