1153 Allen St Springfield, MA 01118
East Forest Park NeighborhoodEstimated Value: $348,000 - $375,000
3
Beds
2
Baths
1,624
Sq Ft
$221/Sq Ft
Est. Value
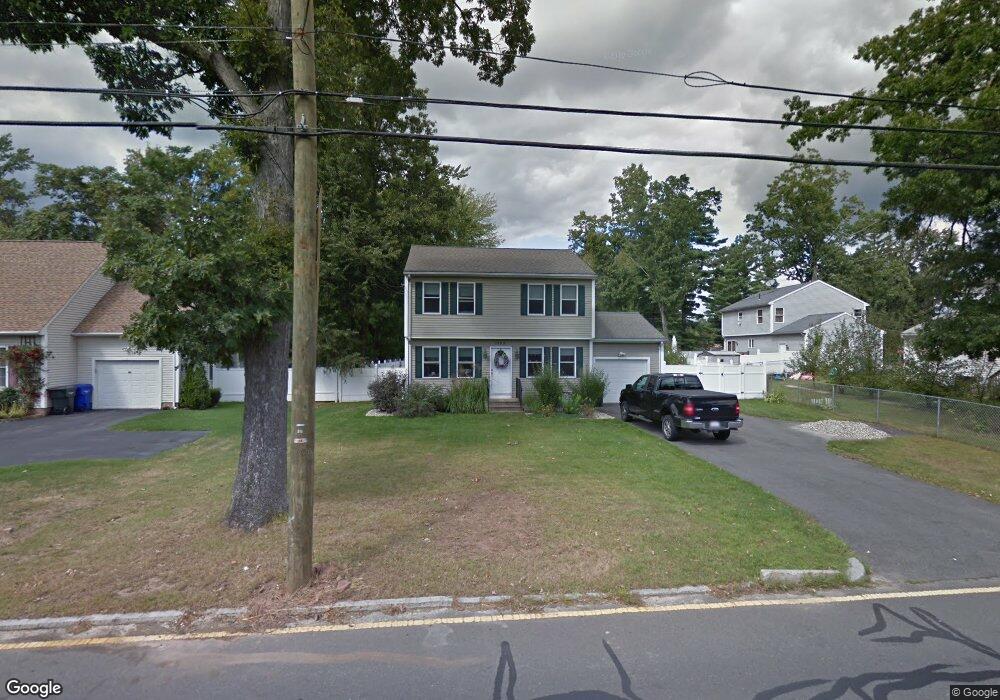
About This Home
This home is located at 1153 Allen St, Springfield, MA 01118 and is currently estimated at $359,309, approximately $221 per square foot. 1153 Allen St is a home located in Hampden County with nearby schools including Frederick Harris Elementary School, M Marcus Kiley Middle, and Springfield High School of Science and Technology.
Ownership History
Date
Name
Owned For
Owner Type
Purchase Details
Closed on
Dec 22, 2003
Sold by
Joyce John B and Gordon Lewis H
Bought by
Eldredge Gary A and Mansolf Sarah M
Current Estimated Value
Home Financials for this Owner
Home Financials are based on the most recent Mortgage that was taken out on this home.
Original Mortgage
$155,000
Outstanding Balance
$72,225
Interest Rate
5.96%
Mortgage Type
Purchase Money Mortgage
Estimated Equity
$287,084
Create a Home Valuation Report for This Property
The Home Valuation Report is an in-depth analysis detailing your home's value as well as a comparison with similar homes in the area
Home Values in the Area
Average Home Value in this Area
Purchase History
| Date | Buyer | Sale Price | Title Company |
|---|---|---|---|
| Eldredge Gary A | $164,900 | -- |
Source: Public Records
Mortgage History
| Date | Status | Borrower | Loan Amount |
|---|---|---|---|
| Open | Eldredge Gary A | $155,000 |
Source: Public Records
Tax History
| Year | Tax Paid | Tax Assessment Tax Assessment Total Assessment is a certain percentage of the fair market value that is determined by local assessors to be the total taxable value of land and additions on the property. | Land | Improvement |
|---|---|---|---|---|
| 2025 | $5,259 | $335,400 | $53,300 | $282,100 |
| 2024 | $5,173 | $322,100 | $53,300 | $268,800 |
| 2023 | $4,719 | $276,800 | $50,700 | $226,100 |
| 2022 | $4,728 | $251,200 | $50,700 | $200,500 |
| 2021 | $4,593 | $243,000 | $46,100 | $196,900 |
| 2020 | $4,406 | $225,600 | $46,100 | $179,500 |
| 2019 | $4,233 | $215,100 | $46,100 | $169,000 |
| 2018 | $4,239 | $215,400 | $46,100 | $169,300 |
| 2017 | $4,252 | $216,300 | $46,100 | $170,200 |
| 2016 | $3,989 | $202,900 | $46,100 | $156,800 |
| 2015 | $3,737 | $190,000 | $46,100 | $143,900 |
Source: Public Records
Map
Nearby Homes
- 55 Allen St
- 19 Manor Ct Unit 19
- 125 Manor Ct Unit 125
- 101 Regal St
- 17 Pebble Mill Rd
- 120 Bridle Path Rd
- 86 Talmadge Dr
- 206 Treetop Ave
- 85 Talmadge Dr
- 647 Plumtree Rd
- 24 Wands St
- 509 Plumtree Rd
- 37 Chesterfield Ave
- 46 Hadley St
- 119 Powell Ave
- 81 W Crystal Brook Dr
- 41 Hillside Dr
- 79 Arvilla St
- 79 Roosevelt Ave
- 7 Ashbrook St
Your Personal Tour Guide
Ask me questions while you tour the home.