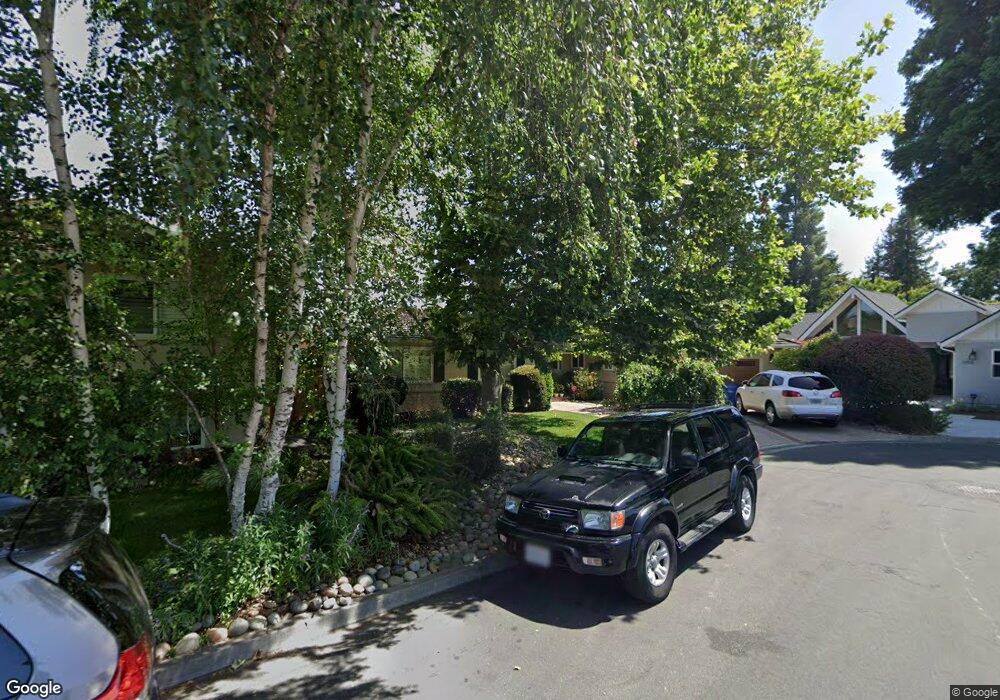
1153 Arnott Way Campbell, CA 95008
Estimated Value: $2,279,000 - $2,777,000
4
Beds
3
Baths
1,971
Sq Ft
$1,287/Sq Ft
Est. Value
About This Home
This home is located at 1153 Arnott Way, Campbell, CA 95008 and is currently estimated at $2,537,091, approximately $1,287 per square foot. 1153 Arnott Way is a home located in Santa Clara County with nearby schools including Bagby Elementary School, Branham High School, and Fammatre Elementary School.
Ownership History
Date
Name
Owned For
Owner Type
Purchase Details
Closed on
Jul 31, 2020
Sold by
Ross Daniel F and Ross Karen F
Bought by
Ross Daniel F and Ross Karen F
Current Estimated Value
Home Financials for this Owner
Home Financials are based on the most recent Mortgage that was taken out on this home.
Original Mortgage
$636,414
Interest Rate
2.9%
Mortgage Type
New Conventional
Purchase Details
Closed on
Jul 3, 2020
Sold by
Ross Daniel F and Ross Karen F
Bought by
Ross Daniel F and Ross Karen F
Home Financials for this Owner
Home Financials are based on the most recent Mortgage that was taken out on this home.
Original Mortgage
$636,414
Interest Rate
2.9%
Mortgage Type
New Conventional
Purchase Details
Closed on
Feb 22, 2019
Sold by
Ross Daniel F and Ross Karen F
Bought by
Ross Daniel F and Ross Karen F
Home Financials for this Owner
Home Financials are based on the most recent Mortgage that was taken out on this home.
Original Mortgage
$633,000
Interest Rate
4.4%
Mortgage Type
New Conventional
Purchase Details
Closed on
Aug 28, 2012
Sold by
Ross Daniel F and Ross Karen F
Bought by
Ross Daniel F and Ross Karen F
Home Financials for this Owner
Home Financials are based on the most recent Mortgage that was taken out on this home.
Original Mortgage
$515,775
Interest Rate
3.5%
Mortgage Type
New Conventional
Purchase Details
Closed on
Feb 6, 2009
Sold by
Ross Daniel F and Ross Karen F
Bought by
Ross Daniel F and Ross Karen F
Home Financials for this Owner
Home Financials are based on the most recent Mortgage that was taken out on this home.
Original Mortgage
$532,000
Interest Rate
5.01%
Mortgage Type
New Conventional
Purchase Details
Closed on
Mar 8, 2006
Sold by
Ross Daniel F and Ross Karen F
Bought by
Ross Daniel F and Ross Karen F
Home Financials for this Owner
Home Financials are based on the most recent Mortgage that was taken out on this home.
Original Mortgage
$481,825
Interest Rate
6.08%
Mortgage Type
New Conventional
Purchase Details
Closed on
Apr 23, 1997
Sold by
Ross Daniel F and Ross Karen F
Bought by
Ross Daniel F and Ross Karen F
Purchase Details
Closed on
Jul 21, 1994
Sold by
Simon Matthew and Simon Betty Jane
Bought by
Ross Daniel F and Ross Karen F
Home Financials for this Owner
Home Financials are based on the most recent Mortgage that was taken out on this home.
Original Mortgage
$267,000
Interest Rate
7%
Create a Home Valuation Report for This Property
The Home Valuation Report is an in-depth analysis detailing your home's value as well as a comparison with similar homes in the area
Home Values in the Area
Average Home Value in this Area
Purchase History
| Date | Buyer | Sale Price | Title Company |
|---|---|---|---|
| Ross Daniel F | -- | Amrock Inc | |
| Ross Daniel F | -- | None Listed On Document | |
| Ross Daniel F | -- | Amrock Inc | |
| Ross Daniel F | -- | None Available | |
| Ross Daniel F | -- | None Available | |
| Ross Daniel F | -- | Accommodation | |
| Ross Daniel F | -- | Orange Coast Title | |
| Ross Daniel F | -- | Orange Coast Title | |
| Ross Daniel F | -- | Orange Coast Title | |
| Ross Daniel F | -- | None Available | |
| Ross Daniel F | -- | Orange Coast Title | |
| Ross Daniel F | -- | -- | |
| Ross Daniel F | $382,500 | Gateway Title Company |
Source: Public Records
Mortgage History
| Date | Status | Borrower | Loan Amount |
|---|---|---|---|
| Previous Owner | Ross Daniel F | $636,414 | |
| Previous Owner | Ross Daniel F | $636,414 | |
| Previous Owner | Ross Daniel F | $633,000 | |
| Previous Owner | Ross Daniel F | $515,775 | |
| Previous Owner | Ross Daniel F | $532,000 | |
| Previous Owner | Ross Daniel F | $481,825 | |
| Previous Owner | Ross Daniel F | $267,000 |
Source: Public Records
Tax History
| Year | Tax Paid | Tax Assessment Tax Assessment Total Assessment is a certain percentage of the fair market value that is determined by local assessors to be the total taxable value of land and additions on the property. | Land | Improvement |
|---|---|---|---|---|
| 2025 | $12,454 | $642,457 | $449,646 | $192,811 |
| 2024 | $12,454 | $629,861 | $440,830 | $189,031 |
| 2023 | $8,394 | $617,512 | $432,187 | $185,325 |
| 2022 | $8,266 | $605,405 | $423,713 | $181,692 |
| 2021 | $8,106 | $593,535 | $415,405 | $178,130 |
| 2020 | $7,725 | $587,450 | $411,146 | $176,304 |
| 2019 | $7,608 | $575,933 | $403,085 | $172,848 |
| 2018 | $7,365 | $564,641 | $395,182 | $169,459 |
| 2017 | $7,351 | $553,571 | $387,434 | $166,137 |
| 2016 | $6,967 | $542,718 | $379,838 | $162,880 |
| 2015 | $6,848 | $534,567 | $374,133 | $160,434 |
| 2014 | $6,650 | $524,097 | $366,805 | $157,292 |
Source: Public Records
Map
Nearby Homes
- 970 Apricot Ave
- 913 Apricot Ave Unit B
- 374 Union Ave Unit D
- 523 Union Ave
- 517 Union Ave
- 511 Union Ave
- 1459 Arroyo Seco Dr
- 133 Union Ave Unit F
- 185 Union Ave Unit 78
- 137 Union Ave Unit A
- 75 Union Ave Unit 5
- 1500 E Campbell Ave
- 1825 Harris Ave
- 61 N Leigh Ave
- 1979 Josephine Ave
- 1844 Frobisher Way
- 912 Campisi Way Unit 417
- 136 Lottie Ln
- 2241 Dry Creek Rd
- 1857 Cabana Dr
- 1155 Arnott Way
- 1139 Arnott Way
- 1166 Cameo Dr
- 1152 Cameo Dr
- 1180 Cameo Dr
- 1138 Cameo Dr
- 1138 Arnott Way
- 1905 Dry Creek Rd
- 1125 Arnott Way
- 1194 Cameo Dr
- 1124 Cameo Dr
- 1911 Dry Creek Rd
- 1120 Arnott Way
- 1210 Cameo Dr
- 1167 Cameo Dr
- 1153 Cameo Dr
- 1181 Cameo Dr
- 1139 Cameo Dr
- 1915 Dry Creek Rd
- 1195 Cameo Dr
Your Personal Tour Guide
Ask me questions while you tour the home.