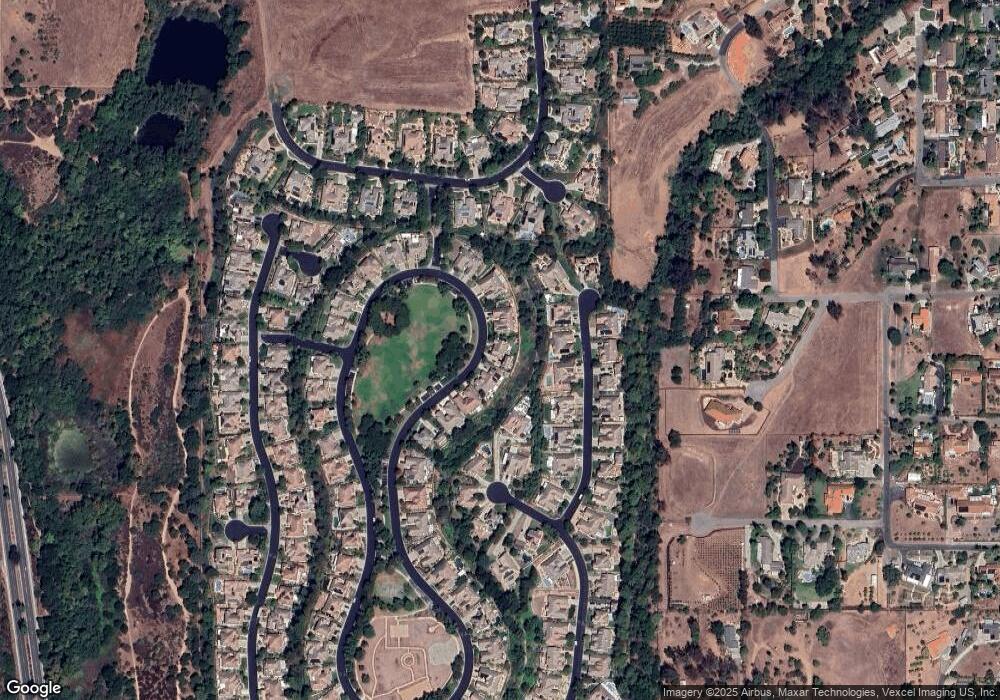
1153 Highland Park Fallbrook, CA 92028
Estimated Value: $1,103,432 - $1,198,000
4
Beds
3
Baths
3,289
Sq Ft
$355/Sq Ft
Est. Value
About This Home
This home is located at 1153 Highland Park, Fallbrook, CA 92028 and is currently estimated at $1,166,108, approximately $354 per square foot. 1153 Highland Park is a home located in San Diego County with nearby schools including Live Oak Elementary School, James E. Potter Intermediate School, and Fallbrook High School.
Ownership History
Date
Name
Owned For
Owner Type
Purchase Details
Closed on
Mar 22, 2001
Sold by
Lmd Fallbrook Llc
Bought by
Dimercurio David Paul and Dimercurio Petty Sue
Current Estimated Value
Home Financials for this Owner
Home Financials are based on the most recent Mortgage that was taken out on this home.
Original Mortgage
$439,100
Interest Rate
7.14%
Mortgage Type
Balloon
Create a Home Valuation Report for This Property
The Home Valuation Report is an in-depth analysis detailing your home's value as well as a comparison with similar homes in the area
Home Values in the Area
Average Home Value in this Area
Purchase History
| Date | Buyer | Sale Price | Title Company |
|---|---|---|---|
| Dimercurio David Paul | $549,000 | First American Title |
Source: Public Records
Mortgage History
| Date | Status | Borrower | Loan Amount |
|---|---|---|---|
| Previous Owner | Dimercurio David Paul | $439,100 |
Source: Public Records
Tax History
| Year | Tax Paid | Tax Assessment Tax Assessment Total Assessment is a certain percentage of the fair market value that is determined by local assessors to be the total taxable value of land and additions on the property. | Land | Improvement |
|---|---|---|---|---|
| 2025 | $8,621 | $827,049 | $226,010 | $601,039 |
| 2024 | $8,621 | $810,833 | $221,579 | $589,254 |
| 2023 | $8,360 | $794,935 | $217,235 | $577,700 |
| 2022 | $8,363 | $779,349 | $212,976 | $566,373 |
| 2021 | $8,084 | $764,068 | $208,800 | $555,268 |
| 2020 | $7,595 | $705,000 | $189,000 | $516,000 |
| 2019 | $7,596 | $705,000 | $189,000 | $516,000 |
| 2018 | $7,304 | $675,000 | $181,000 | $494,000 |
| 2017 | $7,031 | $650,000 | $175,000 | $475,000 |
| 2016 | $6,885 | $640,000 | $173,000 | $467,000 |
| 2015 | $6,602 | $615,000 | $167,000 | $448,000 |
| 2014 | $6,281 | $585,000 | $159,000 | $426,000 |
Source: Public Records
Map
Nearby Homes
- 1089 Inverlochy Dr
- 569 Inverlochy Dr
- 1765 Armadale Rd
- 2116 Kirkcaldy Rd
- 789 Glenhart Place
- 2104 Reineman Rd
- 1630 S Mission Rd
- 0 Mission Rd Unit None
- 0 Mission Rd Unit IG25148608
- 0 Mission Rd Unit NDP2506959
- 0 Camino de Nog
- 1735 S Mission Rd
- 2445 S Stage Coach Ln
- 190 Mission Oaks Rd
- 2715 S Mission Rd
- 2327 Clearcrest Ln
- 1638 Calavo Rd Unit 63
- 0 Laurine Ln
- 820 Cookie Ln
- 1086 Snow Creek Rd
- 1139 Highland Park
- 631 Braemar Terrace
- 643 Braemar Terrace
- 1125 Highland Park
- 619 Braemar Terrace
- 1181 Highland Park
- 655 Braemar Terrace
- 1111 Highland Park
- 607 Braemar Terrace
- 1195 Highland Park
- 667 Braemar Terrace
- 1097 Inverlochy Dr
- 1093 Highland Park
- 626 Braemar Terrace
- 602 Braemar Terrace
- 640 Braemar Terrace
- 614 Braemar Terrace
- 679 Braemar Terrace
- 605 Highland Park
- 654 Braemar Terrace
Your Personal Tour Guide
Ask me questions while you tour the home.
