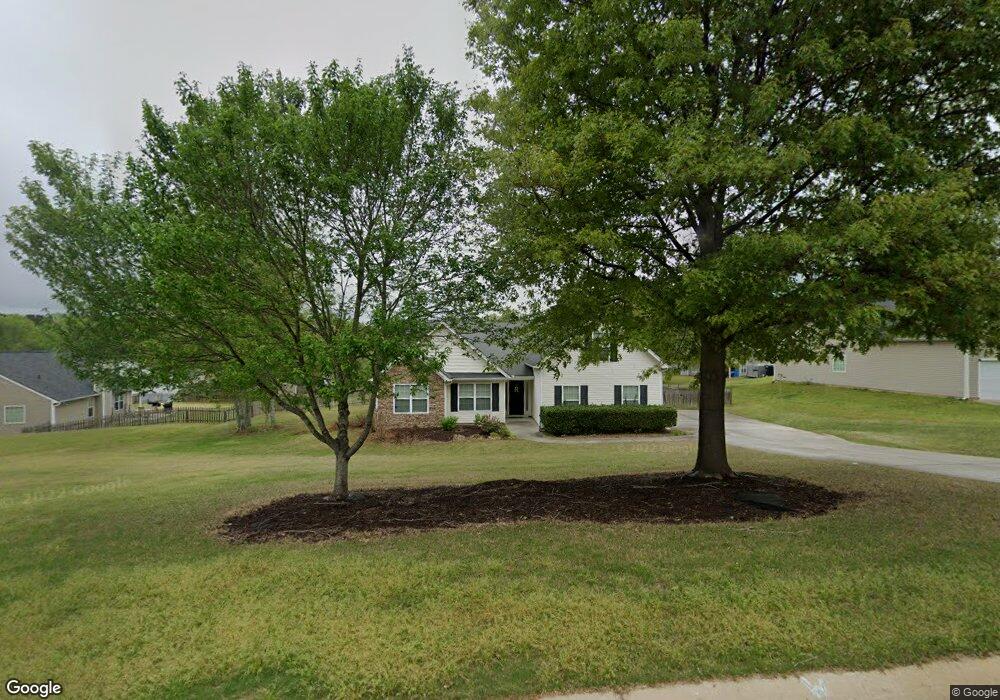
1153 Otis Dr Bethlehem, GA 30620
Estimated Value: $330,570 - $344,000
Studio
2
Baths
1,789
Sq Ft
$187/Sq Ft
Est. Value
About This Home
This home is located at 1153 Otis Dr, Bethlehem, GA 30620 and is currently estimated at $335,143, approximately $187 per square foot. 1153 Otis Dr is a home located in Barrow County with nearby schools including Yargo Elementary School, Haymon-Morris Middle School, and Apalachee High School.
Ownership History
Date
Name
Owned For
Owner Type
Purchase Details
Closed on
Mar 7, 2018
Sold by
Raza Syed H
Bought by
Raza Syed H and Raza Tia Raquel
Current Estimated Value
Purchase Details
Closed on
May 27, 2016
Sold by
Ragland John S
Bought by
Raza Syed H
Home Financials for this Owner
Home Financials are based on the most recent Mortgage that was taken out on this home.
Original Mortgage
$124,000
Interest Rate
3.66%
Mortgage Type
New Conventional
Purchase Details
Closed on
Apr 13, 2007
Sold by
Crown Park Hms Of Cambridge Ll
Bought by
Ragland John S and Ragland Deborah C
Home Financials for this Owner
Home Financials are based on the most recent Mortgage that was taken out on this home.
Original Mortgage
$172,700
Interest Rate
6.1%
Mortgage Type
New Conventional
Purchase Details
Closed on
Jun 11, 2004
Sold by
Millstone Development Group In
Bought by
Crown Park Homes At Cambridge Llc
Purchase Details
Closed on
Apr 1, 2004
Bought by
Millstone Development Group Inc
Create a Home Valuation Report for This Property
The Home Valuation Report is an in-depth analysis detailing your home's value as well as a comparison with similar homes in the area
Home Values in the Area
Average Home Value in this Area
Purchase History
| Date | Buyer | Sale Price | Title Company |
|---|---|---|---|
| Raza Syed H | -- | -- | |
| Raza Syed H | $155,000 | -- | |
| Ragland John S | $172,800 | -- | |
| Crown Park Homes At Cambridge Llc | $38,500 | -- | |
| Millstone Development Group Inc | -- | -- |
Source: Public Records
Mortgage History
| Date | Status | Borrower | Loan Amount |
|---|---|---|---|
| Previous Owner | Raza Syed H | $124,000 | |
| Previous Owner | Ragland John S | $172,700 |
Source: Public Records
Tax History
| Year | Tax Paid | Tax Assessment Tax Assessment Total Assessment is a certain percentage of the fair market value that is determined by local assessors to be the total taxable value of land and additions on the property. | Land | Improvement |
|---|---|---|---|---|
| 2025 | $3,129 | $133,987 | $28,000 | $105,987 |
| 2024 | $3,223 | $130,980 | $28,000 | $102,980 |
| 2023 | $2,631 | $123,752 | $28,000 | $95,752 |
| 2022 | $2,489 | $87,526 | $22,400 | $65,126 |
| 2021 | $2,160 | $71,966 | $18,000 | $53,966 |
| 2020 | $2,027 | $67,502 | $18,000 | $49,502 |
| 2019 | $2,061 | $67,502 | $18,000 | $49,502 |
| 2018 | $1,921 | $63,702 | $14,200 | $49,502 |
| 2017 | $1,593 | $54,716 | $14,200 | $40,516 |
| 2016 | $1,395 | $47,572 | $14,200 | $33,372 |
| 2015 | $1,412 | $47,927 | $14,200 | $33,727 |
| 2014 | $1,241 | $41,921 | $7,840 | $34,081 |
| 2013 | -- | $39,409 | $7,840 | $31,569 |
Source: Public Records
Map
Nearby Homes
- 1202 Benton Ct
- 611 Mcdowell Ln
- 627 Bridle Creek Dr
- 1111 Otis Dr
- 923 Downing Dr
- 732 Ridgeland Rd
- 1129 Loganville Hwy
- 631 Saddle Ridge Dr
- 1256 Loganville Hwy
- 907 Downing Dr
- 738 Worth Ct
- 1562 Pointe South Cir
- 1583 Pointe South Cir
- 724 Westbury Dr
- 1587 Pointe South Cir
- 209 Angie Way
- 720 Westbury Ct
- 1513 Pointe South Cir
- 85 Silverleaf Trail
- 73 Silverleaf Trail
- 601 Mcdowell Ln
- 1149 Otis Dr
- 1149 Otis Dr Unit 1149
- 603 Mcdowell Ln
- 603 Mcdowell Ln
- 603 Mcdowell Ln Unit GA14369
- 603 Mcdowell Ln Unit Ga1436
- 508 Bentley Cir
- 510 Bentley Cir
- 502 Bentley Cir
- 605 Mcdowell Ln Unit 75
- 605 Mcdowell Ln
- 1152 Otis Dr
- 1154 Otis Dr
- 1150 Otis Dr
- 600 Mcdowell Ln
- 512 Bentley Cir
- 1156 Otis Dr
- 1148 Otis Dr
- 607 Mcdowell Ln
Your Personal Tour Guide
Ask me questions while you tour the home.