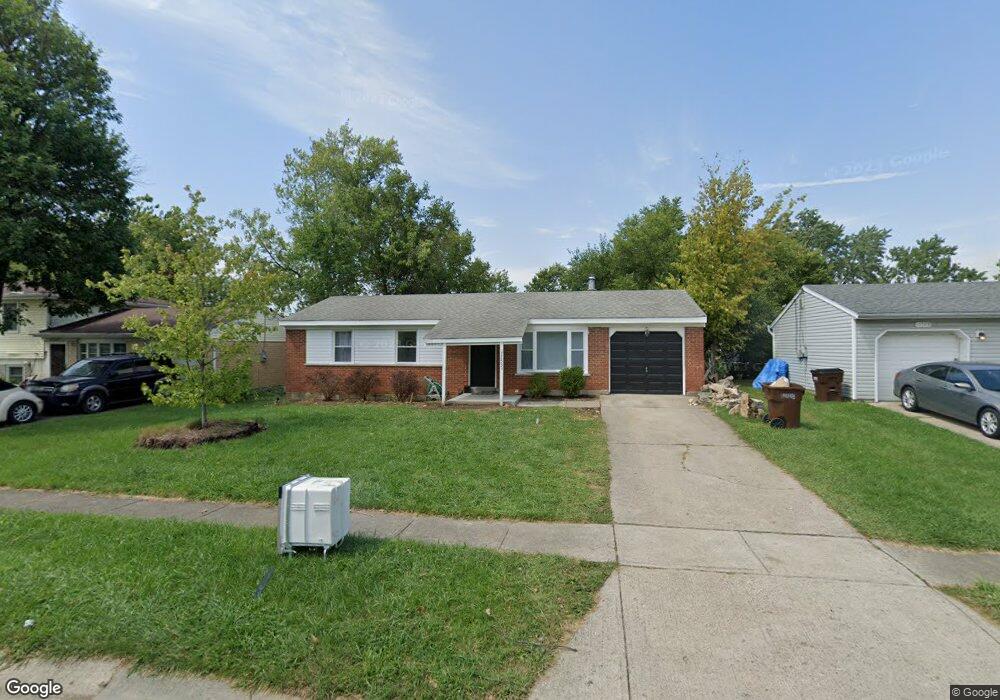
11533 Raphael Place Cincinnati, OH 45240
Estimated Value: $174,299 - $190,000
3
Beds
1
Bath
875
Sq Ft
$206/Sq Ft
Est. Value
About This Home
This home is located at 11533 Raphael Place, Cincinnati, OH 45240 and is currently estimated at $180,325, approximately $206 per square foot. 11533 Raphael Place is a home located in Hamilton County with nearby schools including Hamilton County Mathematics and Science Academy, Beautiful Savior Lutheran School, and Central Montessori Academy.
Ownership History
Date
Name
Owned For
Owner Type
Purchase Details
Closed on
Sep 23, 2018
Sold by
Turner Chris
Bought by
Turner Family Homes Llc
Current Estimated Value
Purchase Details
Closed on
Dec 19, 2014
Sold by
Turner Lovell and Turner Pearl
Bought by
Turner Chris
Purchase Details
Closed on
Nov 15, 2011
Sold by
Krieger Francis D
Bought by
Turner Lovell
Purchase Details
Closed on
Dec 9, 2008
Sold by
Krieger Francis D
Bought by
Kreiger Francis D and Krieger Kevin F
Purchase Details
Closed on
May 26, 2006
Sold by
Nelson James H and Nelson Diane L
Bought by
Krieger Francis D and Krieger Judith F
Home Financials for this Owner
Home Financials are based on the most recent Mortgage that was taken out on this home.
Original Mortgage
$65,000
Interest Rate
6.66%
Mortgage Type
Unknown
Create a Home Valuation Report for This Property
The Home Valuation Report is an in-depth analysis detailing your home's value as well as a comparison with similar homes in the area
Home Values in the Area
Average Home Value in this Area
Purchase History
| Date | Buyer | Sale Price | Title Company |
|---|---|---|---|
| Turner Family Homes Llc | -- | None Available | |
| Turner Chris | $32,000 | Attorney | |
| Turner Lovell | $32,000 | None Available | |
| Kreiger Francis D | -- | Attorney | |
| Krieger Francis D | $95,000 | None Available |
Source: Public Records
Mortgage History
| Date | Status | Borrower | Loan Amount |
|---|---|---|---|
| Previous Owner | Krieger Francis D | $65,000 |
Source: Public Records
Tax History
| Year | Tax Paid | Tax Assessment Tax Assessment Total Assessment is a certain percentage of the fair market value that is determined by local assessors to be the total taxable value of land and additions on the property. | Land | Improvement |
|---|---|---|---|---|
| 2025 | $2,462 | $40,671 | $8,978 | $31,693 |
| 2024 | $2,464 | $40,671 | $8,978 | $31,693 |
| 2023 | $2,450 | $40,671 | $8,978 | $31,693 |
| 2022 | $2,312 | $29,124 | $7,182 | $21,942 |
| 2021 | $2,304 | $29,124 | $7,182 | $21,942 |
| 2020 | $2,426 | $29,124 | $7,182 | $21,942 |
| 2019 | $2,171 | $24,269 | $5,985 | $18,284 |
| 2018 | $2,464 | $24,269 | $5,985 | $18,284 |
| 2017 | $2,024 | $24,269 | $5,985 | $18,284 |
| 2016 | $955 | $11,200 | $5,985 | $5,215 |
| 2015 | $925 | $11,200 | $5,985 | $5,215 |
| 2014 | $818 | $11,200 | $5,985 | $5,215 |
| 2013 | $801 | $11,200 | $5,985 | $5,215 |
Source: Public Records
Map
Nearby Homes
- 2171 Rangoon Ct
- 11484 Ravensburg Ct
- 11717 Hamilton Ave
- 2465 Owlcrest Dr
- 1944 Creswell Dr
- 2017 Broadhurst Ave
- 11777 Cedarcreek Dr
- 11586 Pippin Rd
- 11505 Oxfordshire Ln
- 2617 Chesterhill Dr
- 11835 Wincanton Dr
- 11440 Mill Rd
- 11537 Norbourne Dr
- 10897 Sprucehill Dr
- 11995 Wincanton Dr
- 12080 Regency Run Ct Unit 4
- 11955 Mill Rd
- 10945 Crystalhill Ct
- 11911 Pippin Rd
- 10877 Birchridge Dr
- 11525 Raphael Place
- 11549 Raphael Place
- 2073 Rubicon Place
- 2081 Rubicon Place
- 11517 Raphael Place
- 2059 Rubicon Place
- 11565 Raphael Place
- 11516 Rodoan Ct
- 11534 Raphael Place
- 11526 Raphael Place
- 11509 Raphael Place
- 2089 Rubicon Place
- 11524 Rodoan Ct
- 11518 Raphael Place
- 11508 Rodoan Ct
- 11550 Raphael Place
- 11510 Raphael Place
- 11532 Rodoan Ct
- 11558 Raphael Place
- 11502 Raphael Place
Your Personal Tour Guide
Ask me questions while you tour the home.