
1154 Crescent View Dr NE Cedar Rapids, IA 52402
2
Beds
2
Baths
1,203
Sq Ft
$65/mo
HOA Fee
Highlights
- New Construction
- Vaulted Ceiling
- 1 Car Attached Garage
- Westfield Elementary School Rated A
- Ranch Style House
- Eat-In Kitchen
About This Home
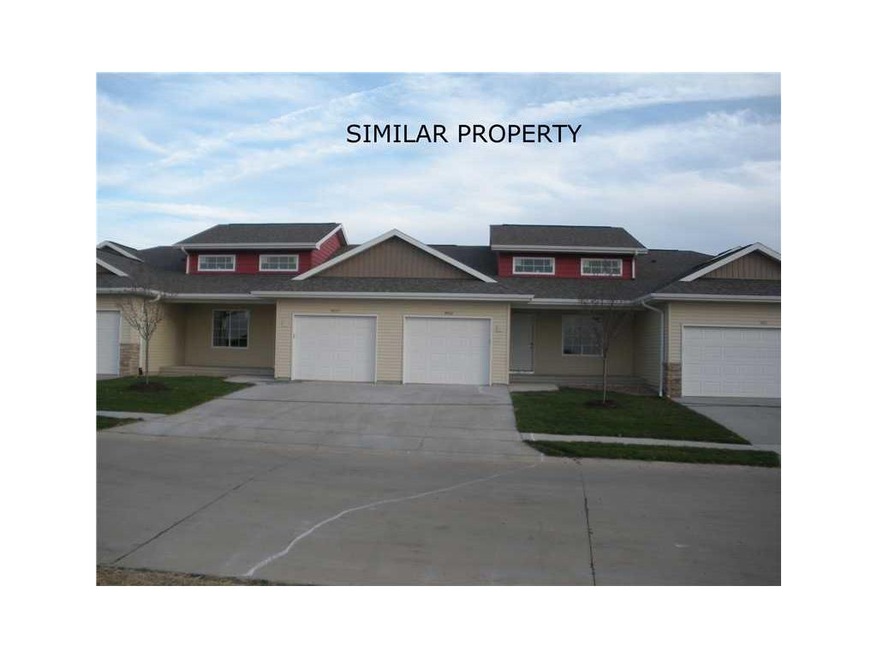
As of January 2023THIS INCREDIBLE LANSING RANCH PLAN IS LOCATED IN THE NEW CRESCENT VIEW DEVELOPMENT ON THE NORTHEAST SIDE AND HAS PLENTY TO OFFER. THIS UNIT INCLUDES VAULTED CEILINGS, MAIN LEVEL LAUNDRY, 2 BEDROOMS AND 2 BATHROOMS. THE BUYER WILL HAVE THE OPPORTUNITY TO MAKE SELECTIONS FROM A HIGH QUALITY GROUP OF PRODUCTS. THE STANDARD PRICE INCLUDES 3 VARITIES OF CARPETING WITH A TOTAL OF 58 COLORS. THERE ARE OVER 90 CHOICES OF VINYL AND 15+ CHOICES OF TILE. THE LIGHTING AND DOOR HARDWARE ARE AVAILABLE IN 2 FINISHES. CABINETS COME IN 8 SYLTES WITH A TOTAL OF 36 FINISH COMBINATIONS. THERE ARE MULTIPLE COUNTERTOP CHOICES AND THE KITCHEN APPLIANCES ARE AVAILABLE IN BLACK OR WHITE. FLOOR PLAN ATTACHED. THERE IS A $120 ASSOCIATION START UP FEE.
Last Agent to Sell the Property
Lana Thies
IOWA REALTY
Property Details
Home Type
- Condominium
Est. Annual Taxes
- $3,908
Year Built
- 2012
HOA Fees
- $65 Monthly HOA Fees
Home Design
- Ranch Style House
- Poured Concrete
- Frame Construction
- Vinyl Construction Material
Interior Spaces
- 1,203 Sq Ft Home
- Vaulted Ceiling
- Family Room
- Basement Fills Entire Space Under The House
Kitchen
- Eat-In Kitchen
- Range
- Microwave
- Dishwasher
- Disposal
Bedrooms and Bathrooms
- 2 Main Level Bedrooms
- 2 Full Bathrooms
Parking
- 1 Car Attached Garage
- Garage Door Opener
Outdoor Features
- Patio
Utilities
- Forced Air Cooling System
- Heating System Uses Gas
- Gas Water Heater
- Cable TV Available
Community Details
Overview
- Built by ABODE CONST
Pet Policy
- Pets Allowed
Ownership History
Date
Name
Owned For
Owner Type
Purchase Details
Listed on
Jun 27, 2022
Closed on
Jan 25, 2023
Sold by
Hogg Mary Carolyn
Bought by
Sevening Haley B
Seller's Agent
John Beck
Iowa Realty, Inc. - CR
Buyer's Agent
Nonmember NONMEMBER
NONMEMBER
List Price
$224,000
Sold Price
$170,000
Premium/Discount to List
-$54,000
-24.11%
Total Days on Market
149
Views
240
Current Estimated Value
Home Financials for this Owner
Home Financials are based on the most recent Mortgage that was taken out on this home.
Estimated Appreciation
$55,528
Avg. Annual Appreciation
12.45%
Original Mortgage
$136,000
Outstanding Balance
$132,430
Interest Rate
6.27%
Mortgage Type
New Conventional
Estimated Equity
$90,778
Purchase Details
Listed on
May 16, 2019
Closed on
Aug 2, 2019
Sold by
Fnu Aashish Aroon and Rao Divya Shivkumar
Bought by
Hogg Mary
Seller's Agent
Mary Chmelicek
SKOGMAN REALTY
Buyer's Agent
Steven Beltramea Sr.
Exit Eastern Iowa Real Estate
List Price
$165,000
Sold Price
$160,000
Premium/Discount to List
-$5,000
-3.03%
Home Financials for this Owner
Home Financials are based on the most recent Mortgage that was taken out on this home.
Avg. Annual Appreciation
1.78%
Original Mortgage
$128,000
Interest Rate
3.7%
Purchase Details
Listed on
Apr 14, 2016
Closed on
Jun 13, 2016
Sold by
Heck Diana L
Bought by
Fnu Aashish Aroon
Seller's Agent
Arlene Heck
RE/MAX CONCEPTS
Buyer's Agent
John Beltramea
EXIT Eastern Iowa Real Estate Corridor
List Price
$135,000
Sold Price
$132,000
Premium/Discount to List
-$3,000
-2.22%
Home Financials for this Owner
Home Financials are based on the most recent Mortgage that was taken out on this home.
Avg. Annual Appreciation
6.24%
Original Mortgage
$118,800
Interest Rate
3.58%
Mortgage Type
Commercial
Purchase Details
Listed on
Jun 18, 2012
Closed on
Dec 17, 2012
Sold by
Abode Construction Inc
Bought by
Heck Diana L
Seller's Agent
Lana Thies
IOWA REALTY
Buyer's Agent
Arlene Heck
RE/MAX CONCEPTS
List Price
$119,900
Sold Price
$130,587
Premium/Discount to List
$10,687
8.91%
Home Financials for this Owner
Home Financials are based on the most recent Mortgage that was taken out on this home.
Avg. Annual Appreciation
0.31%
Original Mortgage
$97,940
Interest Rate
3.34%
Mortgage Type
New Conventional
Map
Create a Home Valuation Report for This Property
The Home Valuation Report is an in-depth analysis detailing your home's value as well as a comparison with similar homes in the area
Similar Homes in the area
Home Values in the Area
Average Home Value in this Area
Purchase History
| Date | Type | Sale Price | Title Company |
|---|---|---|---|
| Fiduciary Deed | $170,000 | -- | |
| Warranty Deed | $160,000 | Stewart Title Guaranty Co | |
| Warranty Deed | -- | None Available | |
| Warranty Deed | $131,000 | None Available |
Source: Public Records
Mortgage History
| Date | Status | Loan Amount | Loan Type |
|---|---|---|---|
| Open | $136,000 | New Conventional | |
| Previous Owner | $128,000 | No Value Available | |
| Previous Owner | $118,800 | Commercial | |
| Previous Owner | $97,940 | New Conventional |
Source: Public Records
Property History
| Date | Event | Price | Change | Sq Ft Price |
|---|---|---|---|---|
| 01/27/2023 01/27/23 | Sold | $170,000 | -8.1% | $137 / Sq Ft |
| 01/24/2023 01/24/23 | Pending | -- | -- | -- |
| 10/25/2022 10/25/22 | Price Changed | $185,000 | -5.1% | $149 / Sq Ft |
| 09/29/2022 09/29/22 | Price Changed | $195,000 | -2.5% | $158 / Sq Ft |
| 08/16/2022 08/16/22 | Price Changed | $200,000 | -6.5% | $162 / Sq Ft |
| 07/12/2022 07/12/22 | Price Changed | $214,000 | -4.5% | $173 / Sq Ft |
| 06/27/2022 06/27/22 | For Sale | $224,000 | +40.0% | $181 / Sq Ft |
| 08/19/2019 08/19/19 | Sold | $160,000 | -1.2% | $129 / Sq Ft |
| 07/19/2019 07/19/19 | Pending | -- | -- | -- |
| 07/09/2019 07/09/19 | Price Changed | $162,000 | -1.8% | $131 / Sq Ft |
| 05/16/2019 05/16/19 | For Sale | $165,000 | +25.0% | $133 / Sq Ft |
| 06/15/2016 06/15/16 | Sold | $132,000 | -2.2% | $110 / Sq Ft |
| 04/24/2016 04/24/16 | Pending | -- | -- | -- |
| 04/14/2016 04/14/16 | For Sale | $135,000 | +3.4% | $112 / Sq Ft |
| 12/19/2012 12/19/12 | Sold | $130,587 | +8.9% | $109 / Sq Ft |
| 11/14/2012 11/14/12 | Pending | -- | -- | -- |
| 06/18/2012 06/18/12 | For Sale | $119,900 | -- | $100 / Sq Ft |
Source: Cedar Rapids Area Association of REALTORS®
Tax History
| Year | Tax Paid | Tax Assessment Tax Assessment Total Assessment is a certain percentage of the fair market value that is determined by local assessors to be the total taxable value of land and additions on the property. | Land | Improvement |
|---|---|---|---|---|
| 2023 | $3,908 | $219,700 | $35,500 | $184,200 |
| 2022 | $3,640 | $179,900 | $30,000 | $149,900 |
| 2021 | $3,776 | $173,400 | $30,000 | $143,400 |
| 2020 | $3,776 | $169,400 | $26,000 | $143,400 |
| 2019 | $3,430 | $156,200 | $26,000 | $130,200 |
| 2018 | $2,884 | $156,200 | $26,000 | $130,200 |
| 2017 | $2,841 | $130,300 | $12,000 | $118,300 |
| 2016 | $2,841 | $130,300 | $12,000 | $118,300 |
| 2015 | $2,646 | $124,039 | $12,000 | $112,039 |
| 2014 | $2,508 | $124,039 | $12,000 | $112,039 |
| 2013 | $2,418 | $124,039 | $12,000 | $112,039 |
Source: Public Records
Source: Cedar Rapids Area Association of REALTORS®
MLS Number: 1204539
APN: 11273-82002-01008
Disclaimer: Certain information contained herein is derived from information provided by parties other than Homes.com. All information provided is deemed reliable, but is not guaranteed to be accurate and should be independently verified.
![]() IDX information is provided exclusively for personal, non-commercial use, and may not be used for any purpose other than to identify prospective properties consumers may be interested in purchasing.
IDX information is provided exclusively for personal, non-commercial use, and may not be used for any purpose other than to identify prospective properties consumers may be interested in purchasing.
Information is deemed reliable but not guaranteed.
Nearby Homes
- 1144 Crescent View Dr NE
- 1107 74th St NE
- 1153 74th St NE Unit 1153
- 7615 Westfield Dr NE
- 1237 74th St NE
- 1108 Acacia Dr NE
- 7633 Westfield Dr NE
- 1018 Deer Run Dr NE
- 7701 Westfield Dr NE
- 900 Chesterfield Rd NE
- 942 71st St NE
- 815 Deer Run Dr NE
- 8139 Turtlerun Dr NE
- 817 Winterberry Place NE
- 1312 Prairieview Dr NE
- 1227 Petrus Dr NE
- 1023 Doubletree Ct NE Unit 1023
- 827 Dorchester Place NE
- 923 Messina Dr NE
- 934 White Ivy Place NE