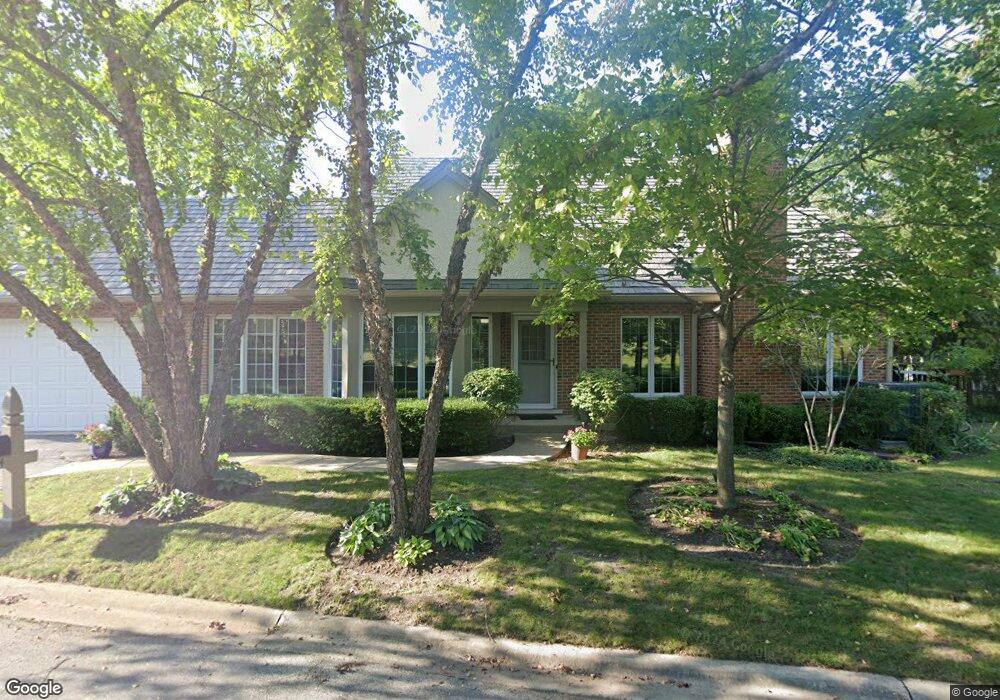
1154 Lynette Dr Unit 73 Lake Forest, IL 60045
Estimated Value: $544,000 - $724,000
3
Beds
3
Baths
2,293
Sq Ft
$283/Sq Ft
Est. Value
About This Home
This home is located at 1154 Lynette Dr Unit 73, Lake Forest, IL 60045 and is currently estimated at $648,806, approximately $282 per square foot. 1154 Lynette Dr Unit 73 is a home located in Lake County with nearby schools including Everett Elementary School, Deer Path Middle School East, and Lake Forest High School.
Ownership History
Date
Name
Owned For
Owner Type
Purchase Details
Closed on
Apr 15, 1997
Sold by
Grossman Larry and Grossman Richard
Bought by
Bird Pamela C
Current Estimated Value
Home Financials for this Owner
Home Financials are based on the most recent Mortgage that was taken out on this home.
Original Mortgage
$230,000
Outstanding Balance
$31,335
Interest Rate
8.5%
Estimated Equity
$617,471
Purchase Details
Closed on
Sep 3, 1996
Sold by
Miller Jeffrey K and Miller Mary A Reid
Bought by
Grossman Richard
Purchase Details
Closed on
May 12, 1994
Sold by
Hough John W and Hough Leslie Lincoln
Bought by
Miller Jeffrey K and Miller Mary A Reid
Home Financials for this Owner
Home Financials are based on the most recent Mortgage that was taken out on this home.
Original Mortgage
$319,500
Interest Rate
4.62%
Create a Home Valuation Report for This Property
The Home Valuation Report is an in-depth analysis detailing your home's value as well as a comparison with similar homes in the area
Home Values in the Area
Average Home Value in this Area
Purchase History
| Date | Buyer | Sale Price | Title Company |
|---|---|---|---|
| Bird Pamela C | $330,000 | -- | |
| Grossman Richard | $328,000 | Standard Title | |
| Miller Jeffrey K | $358,000 | Chicago Title Insurance Co |
Source: Public Records
Mortgage History
| Date | Status | Borrower | Loan Amount |
|---|---|---|---|
| Open | Bird Pamela C | $230,000 | |
| Previous Owner | Miller Jeffrey K | $319,500 |
Source: Public Records
Tax History Compared to Growth
Tax History
| Year | Tax Paid | Tax Assessment Tax Assessment Total Assessment is a certain percentage of the fair market value that is determined by local assessors to be the total taxable value of land and additions on the property. | Land | Improvement |
|---|---|---|---|---|
| 2024 | $8,049 | $167,859 | $23,574 | $144,285 |
| 2023 | $8,343 | $144,670 | $22,624 | $122,046 |
| 2022 | $8,343 | $149,985 | $19,502 | $130,483 |
| 2021 | $7,810 | $155,749 | $18,803 | $136,946 |
| 2020 | $7,591 | $156,077 | $18,843 | $137,234 |
| 2019 | $7,253 | $155,812 | $18,811 | $137,001 |
| 2018 | $6,934 | $159,363 | $19,937 | $139,426 |
| 2017 | $6,878 | $158,854 | $19,873 | $138,981 |
| 2016 | $6,934 | $152,848 | $19,122 | $133,726 |
| 2015 | $7,281 | $143,614 | $17,967 | $125,647 |
| 2014 | $7,672 | $147,456 | $18,097 | $129,359 |
| 2012 | $7,416 | $146,155 | $17,937 | $128,218 |
Source: Public Records
Map
Nearby Homes
- 1111 S Waukegan Rd Unit 7
- 1330 Kurtis Ln
- 1090 Evergreen Dr
- 1225 Sir William Ln
- 1020 Evergreen Dr
- 1280 Lawrence Ave
- LOT 50 Kajer Ln
- 1318 Kajer Ln
- 620 W Old Elm Rd
- 1401 W Everett Rd
- 555 W Everett Rd
- 931 Coventry Dr
- 1122 S Estate Ln
- 1161 Gavin Ct
- 687 W Old Elm Rd
- 1022 Estes Ave
- 499 W Old Mill Rd
- 1181 Gavin Ct
- 1130 Gavin Ct
- 1352 S Estate Ln
- 1152 Lynette Dr Unit 72
- 1150 Lynette Dr Unit 71
- 1156 Lynette Dr Unit 61
- 1158 Lynette Dr Unit 62
- 1160 Lynette Dr Unit 63
- 1148 Lynette Dr Unit 83
- 1146 Lynette Dr Unit 82
- 1162 Lynette Dr Unit 51
- 1164 Lynette Dr Unit 52
- 1166 Lynette Dr Unit 53
- 1144 Lynette Dr Unit 81
- 1168 Lynette Dr Unit 41
- 1142 Lynette Dr Unit 93
- 1170 Lynette Dr Unit 42
- 1140 Lynette Dr Unit 92
- 1138 Lynette Dr Unit 91
- 1172 Lynette Dr Unit 43
- 1174 Lynette Dr Unit 31
- 1184 Lynette Dr Unit 23
- 1182 Lynette Dr Unit 22