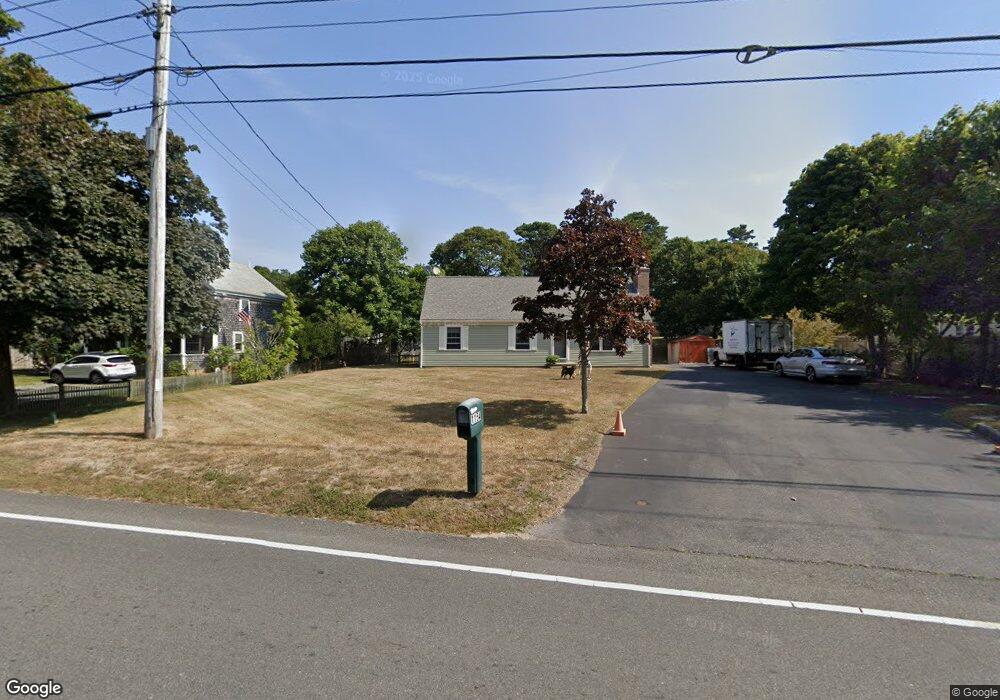
1154 Queen Anne Rd Harwich, MA 02645
Estimated Value: $616,000 - $1,074,000
3
Beds
1
Bath
1,144
Sq Ft
$681/Sq Ft
Est. Value
About This Home
This home is located at 1154 Queen Anne Rd, Harwich, MA 02645 and is currently estimated at $779,013, approximately $680 per square foot. 1154 Queen Anne Rd is a home located in Barnstable County with nearby schools including Chatham Elementary School, Harwich Elementary School, and Monomoy Regional Middle School.
Ownership History
Date
Name
Owned For
Owner Type
Purchase Details
Closed on
Jun 18, 2024
Sold by
Araujo Carlos A
Bought by
Carlos A Araujo Ret and Araujo
Current Estimated Value
Purchase Details
Closed on
Jul 31, 2006
Sold by
Canesi Judy A
Bought by
Araujo Carlos A
Home Financials for this Owner
Home Financials are based on the most recent Mortgage that was taken out on this home.
Original Mortgage
$252,800
Interest Rate
6.67%
Mortgage Type
Purchase Money Mortgage
Purchase Details
Closed on
Jan 19, 1996
Sold by
Citizens Fed Bk
Bought by
Canesi Judy A
Purchase Details
Closed on
Nov 13, 1995
Sold by
Ritacco James P and Ritacco Terri L
Bought by
Citizens Frderal Bank
Create a Home Valuation Report for This Property
The Home Valuation Report is an in-depth analysis detailing your home's value as well as a comparison with similar homes in the area
Home Values in the Area
Average Home Value in this Area
Purchase History
| Date | Buyer | Sale Price | Title Company |
|---|---|---|---|
| Carlos A Araujo Ret | -- | None Available | |
| Araujo Carlos A | $316,000 | -- | |
| Araujo Carlos A | $316,000 | -- | |
| Canesi Judy A | $90,000 | -- | |
| Canesi Judy A | $90,000 | -- | |
| Citizens Frderal Bank | $109,344 | -- | |
| Citizens Frderal Bank | $109,344 | -- |
Source: Public Records
Mortgage History
| Date | Status | Borrower | Loan Amount |
|---|---|---|---|
| Previous Owner | Citizens Frderal Bank | $260,000 | |
| Previous Owner | Araujo Carlos A | $252,800 | |
| Previous Owner | Araujo Carlos A | $31,600 |
Source: Public Records
Tax History Compared to Growth
Tax History
| Year | Tax Paid | Tax Assessment Tax Assessment Total Assessment is a certain percentage of the fair market value that is determined by local assessors to be the total taxable value of land and additions on the property. | Land | Improvement |
|---|---|---|---|---|
| 2025 | $3,239 | $548,100 | $188,000 | $360,100 |
| 2024 | $3,118 | $517,100 | $177,400 | $339,700 |
| 2023 | $2,985 | $449,500 | $161,200 | $288,300 |
| 2022 | $2,934 | $361,800 | $140,200 | $221,600 |
| 2021 | $2,749 | $319,700 | $127,500 | $192,200 |
| 2020 | $2,735 | $313,300 | $126,100 | $187,200 |
| 2019 | $2,563 | $295,600 | $121,100 | $174,500 |
| 2018 | $2,607 | $287,600 | $110,100 | $177,500 |
| 2017 | $2,391 | $266,500 | $100,400 | $166,100 |
| 2016 | $2,351 | $259,200 | $100,400 | $158,800 |
| 2015 | $2,251 | $251,000 | $98,400 | $152,600 |
| 2014 | $2,151 | $245,300 | $95,500 | $149,800 |
Source: Public Records
Map
Nearby Homes
- 24 Chickadee Ln
- 24 Chickadee Cir
- 49 Duck Marsh Ln
- 58 Sugar Hill Dr
- 319 Riverview Dr
- 307 Riverview Dr
- 73 Joshua Jethro Rd
- 1046 Queen Anne Rd
- 47 Whidah Dr
- 97 Round Cove Rd
- 558 Riverview Dr
- 56 Riverview Dr
- 3 Bascom Hollow
- 144 Lakeview Ave
- 355 Training Field Rd
- 0 Tirrells Way
- 0 Evergreen Ln
- 290 Old Comers Rd
- 6 Levi's Ln
- 2386 Main St
- 1318 Old Queen Anne Rd
- 1152 Queen Anne Rd
- 1150 Queen Anne Rd Unit 3
- 1150 Queen Anne Rd Unit 1 & 2
- 1150 Queen Anne Rd Unit 1
- 1150 Queen Anne Rd Unit 2
- 21 Chickadee Ln
- 11 Chickadee Ln
- 24 Chicadee Ln
- 1315 Old Queen Anne Rd
- 1296 Old Queen Anne Rd
- 1347 Old Queen Anne Rd
- 8 Chickadee Ln
- 18 Chickadee Ln
- 1311 Old Queen Anne Rd
- 22 Chickadee Ln
- 1369 Old Queen Anne Rd
- 1283 Old Queen Anne Rd
- 1 Church St
- 1284 Old Queen Anne Rd