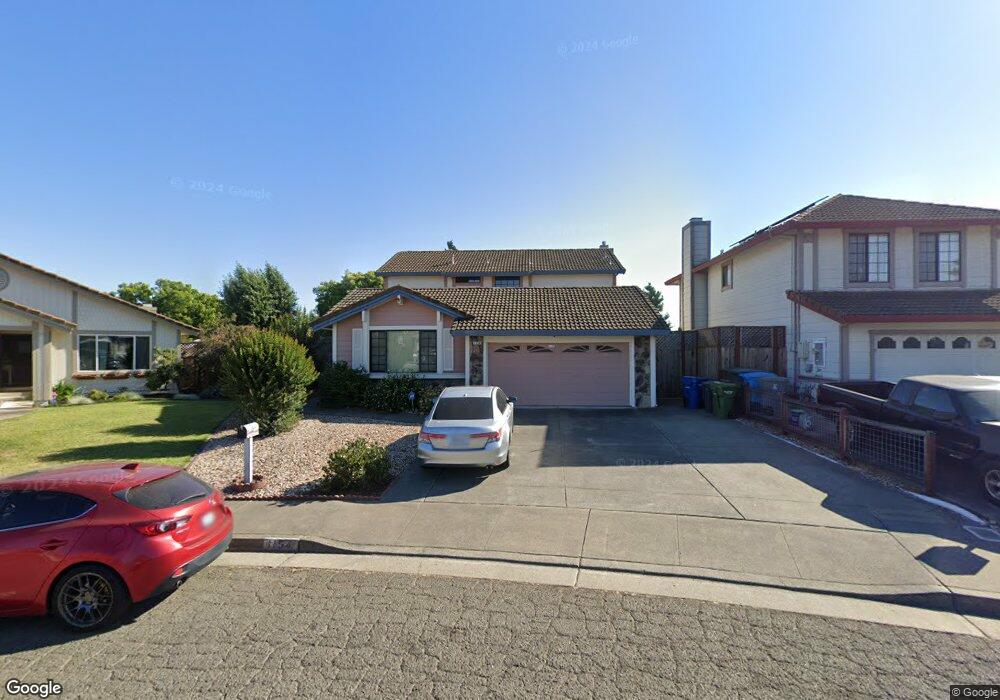
1154 Wieling Way Petaluma, CA 94954
Adobe NeighborhoodEstimated Value: $916,000 - $970,905
4
Beds
3
Baths
2,188
Sq Ft
$433/Sq Ft
Est. Value
About This Home
This home is located at 1154 Wieling Way, Petaluma, CA 94954 and is currently estimated at $948,226, approximately $433 per square foot. 1154 Wieling Way is a home located in Sonoma County with nearby schools including La Tercera Elementary School, Kenilworth Junior High School, and Casa Grande High School.
Ownership History
Date
Name
Owned For
Owner Type
Purchase Details
Closed on
May 18, 2022
Sold by
Revetria Family Trust
Bought by
Revetria Family Trust
Current Estimated Value
Purchase Details
Closed on
Apr 9, 2021
Sold by
Revetria Frederick and Port April
Bought by
Revetria Frederick D and Port April M
Purchase Details
Closed on
Jul 13, 2009
Sold by
Pisa Frank John and Pisa Family Revocable Living T
Bought by
Revetria Frederick and Port April
Home Financials for this Owner
Home Financials are based on the most recent Mortgage that was taken out on this home.
Original Mortgage
$337,500
Interest Rate
5.25%
Mortgage Type
Purchase Money Mortgage
Purchase Details
Closed on
May 31, 2007
Sold by
Torrens Michael A
Bought by
Torrens Sonna L
Purchase Details
Closed on
Dec 2, 1996
Sold by
Pisa Frank J and Pisa Meda
Bought by
Pisa Frank J and Pisa Meda
Create a Home Valuation Report for This Property
The Home Valuation Report is an in-depth analysis detailing your home's value as well as a comparison with similar homes in the area
Home Values in the Area
Average Home Value in this Area
Purchase History
| Date | Buyer | Sale Price | Title Company |
|---|---|---|---|
| Revetria Family Trust | -- | Riordan Sykes Mcfadden Pc | |
| Revetria Frederick D | -- | None Available | |
| Revetria Frederick | $450,000 | Old Republic Title Company | |
| Torrens Sonna L | -- | Old Republic Title Company | |
| Pisa Frank J | -- | -- |
Source: Public Records
Mortgage History
| Date | Status | Borrower | Loan Amount |
|---|---|---|---|
| Previous Owner | Revetria Frederick | $337,500 |
Source: Public Records
Tax History Compared to Growth
Tax History
| Year | Tax Paid | Tax Assessment Tax Assessment Total Assessment is a certain percentage of the fair market value that is determined by local assessors to be the total taxable value of land and additions on the property. | Land | Improvement |
|---|---|---|---|---|
| 2025 | $6,383 | $580,856 | $212,979 | $367,877 |
| 2024 | $6,383 | $569,467 | $208,803 | $360,664 |
| 2023 | $6,383 | $558,302 | $204,709 | $353,593 |
| 2022 | $6,237 | $547,356 | $200,696 | $346,660 |
| 2021 | $6,164 | $536,624 | $196,761 | $339,863 |
| 2020 | $5,377 | $531,123 | $194,744 | $336,379 |
| 2019 | $6,145 | $520,710 | $190,926 | $329,784 |
| 2018 | $5,966 | $510,501 | $187,183 | $323,318 |
| 2017 | $5,880 | $500,492 | $183,513 | $316,979 |
| 2016 | $5,700 | $490,679 | $179,915 | $310,764 |
| 2015 | $5,553 | $483,310 | $177,213 | $306,097 |
| 2014 | $5,498 | $473,843 | $173,742 | $300,101 |
Source: Public Records
Map
Nearby Homes
- 1180 Wieling Way
- 1313 Saint Francis Dr
- 2038 Crinella Dr
- 2014 Crinella Dr
- 1513 Elizabeth Dr
- 1241 Del Rancho Way
- 1627 Juliet Dr
- 1821 Lakeville Hwy Unit 77
- 859 S Mcdowell Blvd
- 1303 Ponderosa Dr
- 1727 Chinar Dr
- 1312 Glenwood Dr
- 12 Birnam Wood Ct
- 1694 Southridge Dr
- 1711 Capistrano Dr
- 1293 Pacific Ave
- 840 Sprucewood Ct
- 602 Marylyn Cir
- 601 Marylyn Cir Unit 21
- 844 Cedarwood Ln
- 1150 Wieling Way
- 1160 Wieling Way
- 1146 Wieling Way
- 1164 Wieling Way
- 1168 Wieling Way
- 1142 Wieling Way
- 1147 Wieling Way
- 1308 S Mcdowell Blvd
- 1312 S Mcdowell Blvd
- 1304 S Mcdowell Blvd
- 1172 Wieling Way
- 1143 Wieling Way
- 1138 Wieling Way
- 1332 Saint Francis Dr
- 1316 S Mcdowell Blvd
- 1176 Wieling Way
- 1156 Daniel Dr
- 1139 Wieling Way
- 1152 Daniel Dr