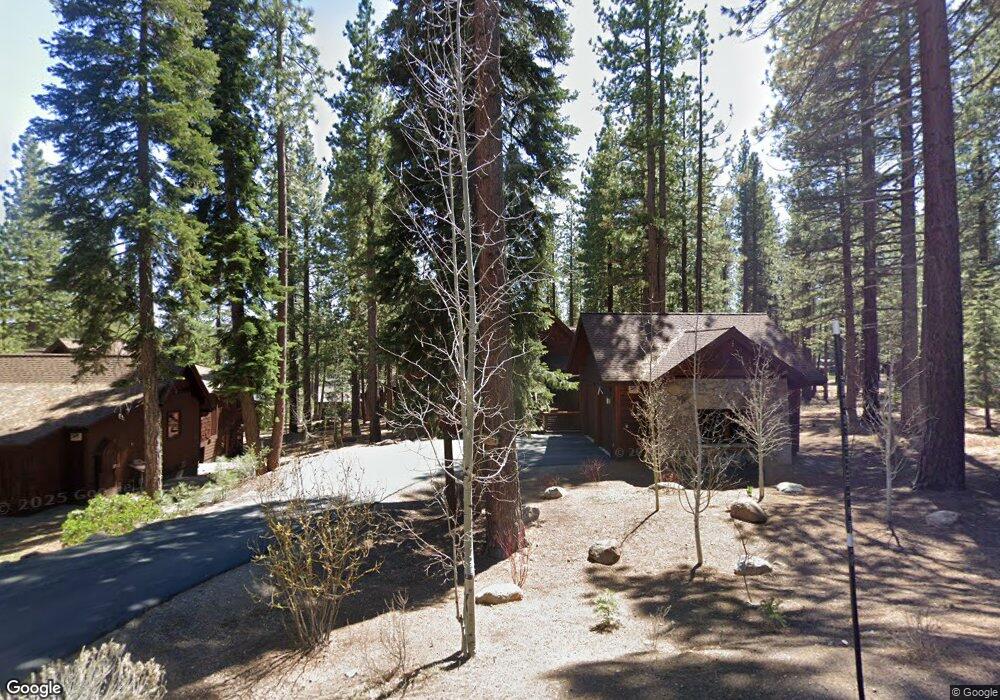
11541 Bottcher Loop Unit W94 Truckee, CA 96161
Gray's Crossing NeighborhoodEstimated Value: $2,140,000 - $2,212,000
4
Beds
4
Baths
3,081
Sq Ft
$706/Sq Ft
Est. Value
About This Home
This home is located at 11541 Bottcher Loop Unit W94, Truckee, CA 96161 and is currently estimated at $2,174,714, approximately $705 per square foot. 11541 Bottcher Loop Unit W94 is a home located in Nevada County with nearby schools including Glenshire Elementary School, Alder Creek Middle School, and Tahoe Truckee High School.
Ownership History
Date
Name
Owned For
Owner Type
Purchase Details
Closed on
Nov 10, 2025
Sold by
Taffe Bennett Family Trust and Taffe Norman Patrick
Bought by
Clark Daniel Trust and Daniel
Current Estimated Value
Home Financials for this Owner
Home Financials are based on the most recent Mortgage that was taken out on this home.
Original Mortgage
$806,502
Outstanding Balance
$804,234
Interest Rate
6.34%
Mortgage Type
New Conventional
Estimated Equity
$1,370,480
Purchase Details
Closed on
Nov 3, 2023
Sold by
Norman Taffe Family Trust
Bought by
Taffe Bennett Family Trust and Taffe
Purchase Details
Closed on
Mar 15, 2016
Sold by
Taffe Norman
Bought by
Taffe Norman and Norman Taffe Family Trust
Purchase Details
Closed on
Jan 8, 2016
Sold by
Taffe Jillian Sonya
Bought by
Taffe Norman
Purchase Details
Closed on
Aug 1, 2011
Sold by
Taffe Norman and Taffe Jillian
Bought by
Taffe Norman and Taffe Jillian Sonya
Purchase Details
Closed on
Mar 24, 2010
Sold by
Ridgewood Enterprises Llc
Bought by
Taffe Norman and Taffe Jillian
Home Financials for this Owner
Home Financials are based on the most recent Mortgage that was taken out on this home.
Original Mortgage
$417,000
Interest Rate
5.01%
Mortgage Type
New Conventional
Create a Home Valuation Report for This Property
The Home Valuation Report is an in-depth analysis detailing your home's value as well as a comparison with similar homes in the area
Home Values in the Area
Average Home Value in this Area
Purchase History
| Date | Buyer | Sale Price | Title Company |
|---|---|---|---|
| Clark Daniel Trust | $2,163,500 | Fidelity National Title | |
| Taffe Bennett Family Trust | -- | None Listed On Document | |
| Taffe Norman | -- | None Available | |
| Taffe Norman | -- | None Available | |
| Taffe Norman | -- | None Available | |
| Taffe Norman | -- | None Available | |
| Taffe Norman | -- | None Available | |
| Taffe Norman | $1,175,000 | First American Title Company |
Source: Public Records
Mortgage History
| Date | Status | Borrower | Loan Amount |
|---|---|---|---|
| Open | Clark Daniel Trust | $806,502 | |
| Previous Owner | Taffe Norman | $417,000 |
Source: Public Records
Tax History
| Year | Tax Paid | Tax Assessment Tax Assessment Total Assessment is a certain percentage of the fair market value that is determined by local assessors to be the total taxable value of land and additions on the property. | Land | Improvement |
|---|---|---|---|---|
| 2025 | $22,739 | $1,526,905 | $77,441 | $1,449,464 |
| 2024 | $22,442 | $1,496,967 | $75,923 | $1,421,044 |
| 2023 | $22,442 | $1,457,812 | $74,435 | $1,383,377 |
| 2022 | $21,960 | $1,429,228 | $72,976 | $1,356,252 |
| 2021 | $21,317 | $1,401,205 | $71,546 | $1,329,659 |
| 2020 | $21,130 | $1,386,838 | $70,813 | $1,316,025 |
| 2019 | $21,096 | $1,359,646 | $69,425 | $1,290,221 |
| 2018 | $0 | $1,332,987 | $68,064 | $1,264,923 |
| 2017 | $19,742 | $1,306,851 | $66,730 | $1,240,121 |
| 2016 | $19,561 | $1,281,227 | $65,422 | $1,215,805 |
| 2015 | $19,118 | $1,261,983 | $64,440 | $1,197,543 |
| 2014 | $19,118 | $1,237,263 | $63,178 | $1,174,085 |
Source: Public Records
Map
Nearby Homes
- 11561 Bottcher Loop
- 11651 Bottcher Loop
- 11670 Bottcher Loop
- 11761 Bottcher Loop
- 11420 Ghirard Rd
- 11841 Bottcher Loop
- 11102 Meek Ct
- 11771 Ghirard Rd
- 11791 Ghirard Rd
- 11210 Henness Rd
- 11585 China Camp Rd
- 10800 Ghirard Ct
- 10576 Brickell Ct
- 10789 Labelle Ct
- 10801 Labelle Ct
- 12400 Rainbow Dr
- 11454 Henness Rd
- 10534 Actinolite Way
- 11392 Lockwood Dr
- 10213 Annies Loop
- 11541 Bottcher Loop Unit Woods
- 11521 Bottcher Loop
- 11501 Bottcher Loop Unit W92
- 11581 Bottcher Loop Unit W 96
- 11581 Bottcher Loop
- 11530 Bottcher Loop
- 11550 Bottcher Loop
- 11544 Kelley Dr
- 11544 Kelley Dr Unit W130
- 11544 Kelley Dr
- 11510 Bottcher Loop
- 11570 Bottcher Loop Unit Lot w-82
- 11570 Bottcher Loop
- 11564 Kelley Dr
- 11524 Kelley Dr Unit W131
- 11524 Kelley Dr
- 11481 Bottcher Loop
- 11481 Bottcher Loop Unit W91
- 11621 Bottcher Loop Unit W97
- 11621 Bottcher Loop Unit Woods 97
Your Personal Tour Guide
Ask me questions while you tour the home.