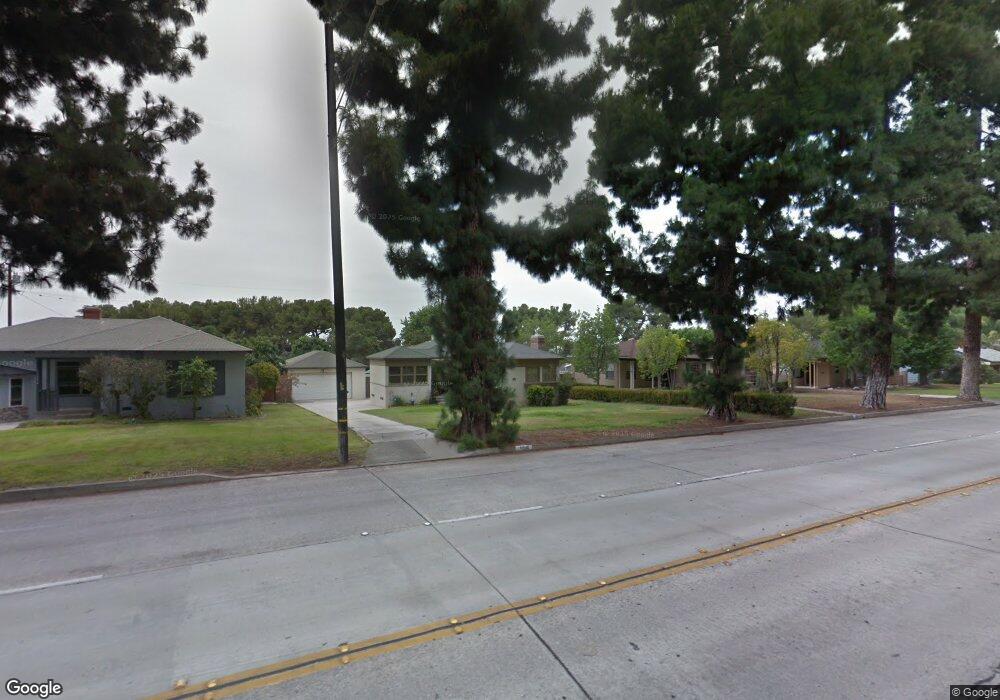
11548 Beverly Blvd Whittier, CA 90601
West Whittier NeighborhoodEstimated Value: $798,000 - $850,007
3
Beds
1
Bath
1,333
Sq Ft
$610/Sq Ft
Est. Value
About This Home
This home is located at 11548 Beverly Blvd, Whittier, CA 90601 and is currently estimated at $813,502, approximately $610 per square foot. 11548 Beverly Blvd is a home located in Los Angeles County with nearby schools including Longfellow Elementary School, Walter F. Dexter Middle School, and Whittier High School.
Ownership History
Date
Name
Owned For
Owner Type
Purchase Details
Closed on
Oct 28, 2019
Sold by
Jimenez John V and Jimenez Anna
Bought by
Juarez Luis A and Juarez Natalie R
Current Estimated Value
Home Financials for this Owner
Home Financials are based on the most recent Mortgage that was taken out on this home.
Original Mortgage
$536,750
Outstanding Balance
$471,256
Interest Rate
3.5%
Estimated Equity
$342,246
Purchase Details
Closed on
Sep 15, 2011
Sold by
Lucero Asset Group
Bought by
Jimenez John and Jimenez Anna
Home Financials for this Owner
Home Financials are based on the most recent Mortgage that was taken out on this home.
Original Mortgage
$355,747
Interest Rate
4.37%
Mortgage Type
FHA
Purchase Details
Closed on
Oct 14, 2010
Sold by
Wells Fargo Bank Na
Bought by
Lucero Asset Group
Purchase Details
Closed on
Aug 11, 2010
Sold by
Trujillo Cesar and Trujillo Martha
Bought by
Wells Fargo Bank Na and Wachovia Mortgage
Create a Home Valuation Report for This Property
The Home Valuation Report is an in-depth analysis detailing your home's value as well as a comparison with similar homes in the area
Home Values in the Area
Average Home Value in this Area
Purchase History
| Date | Buyer | Sale Price | Title Company |
|---|---|---|---|
| Juarez Luis A | $565,000 | Fidelity National Title | |
| Jimenez John | $365,000 | Fidelity National Title Co | |
| Lucero Asset Group | $261,000 | Fidelity National Title Co | |
| Wells Fargo Bank Na | $293,700 | Accommodation |
Source: Public Records
Mortgage History
| Date | Status | Borrower | Loan Amount |
|---|---|---|---|
| Open | Juarez Luis A | $536,750 | |
| Previous Owner | Jimenez John | $355,747 |
Source: Public Records
Tax History
| Year | Tax Paid | Tax Assessment Tax Assessment Total Assessment is a certain percentage of the fair market value that is determined by local assessors to be the total taxable value of land and additions on the property. | Land | Improvement |
|---|---|---|---|---|
| 2025 | $7,416 | $617,906 | $452,767 | $165,139 |
| 2024 | $7,416 | $605,791 | $443,890 | $161,901 |
| 2023 | $7,319 | $593,914 | $435,187 | $158,727 |
| 2022 | $7,255 | $582,269 | $426,654 | $155,615 |
| 2021 | $7,078 | $570,853 | $418,289 | $152,564 |
| 2019 | $5,299 | $410,977 | $235,778 | $175,199 |
| 2018 | $5,103 | $402,919 | $231,155 | $171,764 |
| 2016 | $4,880 | $387,276 | $222,180 | $165,096 |
| 2015 | $4,795 | $381,460 | $218,843 | $162,617 |
| 2014 | $4,701 | $373,989 | $214,557 | $159,432 |
Source: Public Records
Map
Nearby Homes
- 5518 Rockne Ave
- 5315 Bihr Ct
- 10602 Monaco Ct
- 5235 Andalucia Ct
- 5205 Tierra Bonita Dr
- 5422 Carley Ave
- 10605 Cordoba Ct
- 5029 Tierra Antigua Dr Unit 107
- 5058 Tierra Antigua Dr
- 12408 Carinthia Dr
- 12423 Beverly Dr
- 11141 Dorland St
- 5915 Morrill Ave
- 10239 Brian Ct
- 5840 Citrus Ave
- 12530 Carinthia Dr
- 5903 Redman Ave
- 5628 Panorama Dr
- 10608 Whittier Blvd
- 5523 Pioneer Blvd Unit 30
- 11554 Beverly Blvd
- 11542 Beverly Blvd
- 11562 Beverly Blvd
- 11534 Beverly Blvd
- 5524 Palm Ave
- 5512 Palm Ave
- 11568 Beverly Blvd
- 5530 Palm Ave
- 11528 Beverly Blvd
- 11547 Beverly Blvd
- 11541 Beverly Blvd
- 11553 Beverly Blvd
- 5504 Palm Ave
- 11513 Monte Vista Dr
- 11535 Beverly Blvd
- 11561 Beverly Blvd
- 11574 Beverly Blvd
- 11520 Beverly Blvd
- 11505 Monte Vista Dr
- 11567 Beverly Blvd
Your Personal Tour Guide
Ask me questions while you tour the home.