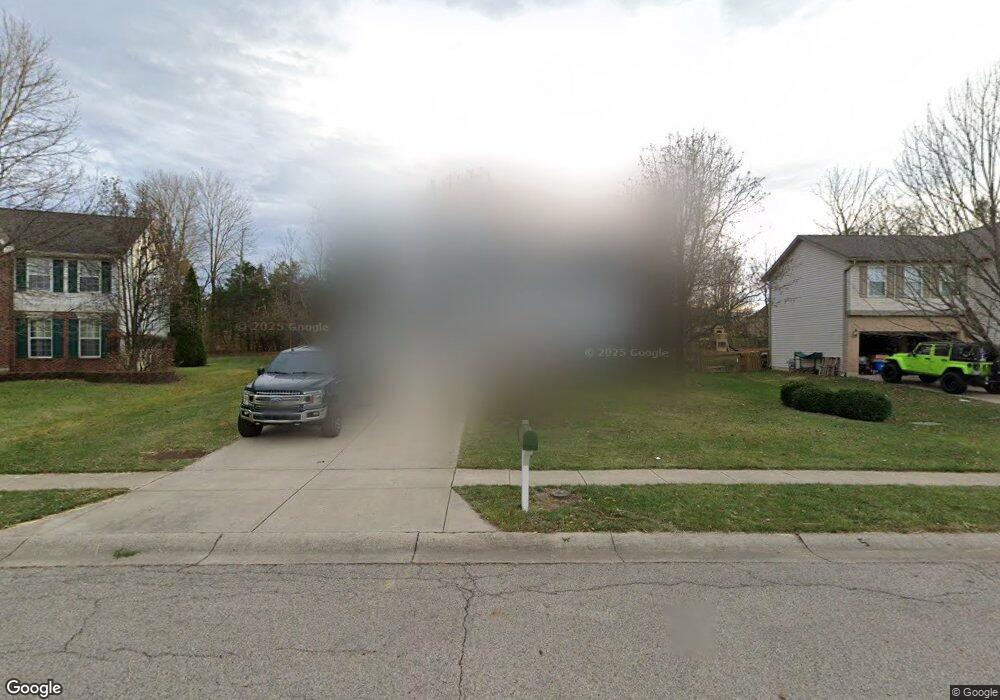
1155 Beargrass Way Maineville, OH 45039
Estimated Value: $406,000 - $449,000
4
Beds
3
Baths
2,322
Sq Ft
$185/Sq Ft
Est. Value
About This Home
This home is located at 1155 Beargrass Way, Maineville, OH 45039 and is currently estimated at $429,756, approximately $185 per square foot. 1155 Beargrass Way is a home located in Warren County with nearby schools including Little Miami Early Childhood Center, Little Miami Intermediate Middle School, and Little Miami Middle School.
Ownership History
Date
Name
Owned For
Owner Type
Purchase Details
Closed on
Jun 13, 2014
Sold by
Skinner Joshua M and Estate Of Melinda A Skinner
Bought by
Trent Elizabeth A and Trent James C
Current Estimated Value
Home Financials for this Owner
Home Financials are based on the most recent Mortgage that was taken out on this home.
Original Mortgage
$181,649
Outstanding Balance
$136,804
Interest Rate
4.25%
Mortgage Type
FHA
Estimated Equity
$292,952
Purchase Details
Closed on
Mar 29, 2000
Sold by
Oberer Residential Const
Bought by
Skinner Melinda A
Home Financials for this Owner
Home Financials are based on the most recent Mortgage that was taken out on this home.
Original Mortgage
$163,000
Interest Rate
8.39%
Mortgage Type
New Conventional
Purchase Details
Closed on
Feb 4, 2000
Sold by
Oberer Dev Co
Bought by
Oberer Residential Const Ltd
Home Financials for this Owner
Home Financials are based on the most recent Mortgage that was taken out on this home.
Original Mortgage
$163,000
Interest Rate
8.39%
Mortgage Type
New Conventional
Create a Home Valuation Report for This Property
The Home Valuation Report is an in-depth analysis detailing your home's value as well as a comparison with similar homes in the area
Home Values in the Area
Average Home Value in this Area
Purchase History
| Date | Buyer | Sale Price | Title Company |
|---|---|---|---|
| Trent Elizabeth A | $185,000 | Stewart Title Co | |
| Skinner Melinda A | $212,584 | -- | |
| Oberer Residential Const Ltd | $106,700 | -- |
Source: Public Records
Mortgage History
| Date | Status | Borrower | Loan Amount |
|---|---|---|---|
| Open | Trent Elizabeth A | $181,649 | |
| Previous Owner | Skinner Melinda A | $163,000 |
Source: Public Records
Tax History
| Year | Tax Paid | Tax Assessment Tax Assessment Total Assessment is a certain percentage of the fair market value that is determined by local assessors to be the total taxable value of land and additions on the property. | Land | Improvement |
|---|---|---|---|---|
| 2025 | $5,187 | $115,830 | $26,250 | $89,580 |
| 2024 | $5,187 | $115,830 | $26,250 | $89,580 |
| 2023 | $4,728 | $94,227 | $16,800 | $77,427 |
| 2022 | $4,674 | $94,227 | $16,800 | $77,427 |
| 2021 | $4,456 | $94,227 | $16,800 | $77,427 |
| 2020 | $4,351 | $78,523 | $14,000 | $64,523 |
| 2019 | $4,423 | $78,523 | $14,000 | $64,523 |
| 2018 | $4,277 | $78,523 | $14,000 | $64,523 |
| 2017 | $3,672 | $66,763 | $12,569 | $54,194 |
| 2016 | $3,759 | $66,763 | $12,569 | $54,194 |
| 2015 | $3,754 | $66,763 | $12,569 | $54,194 |
| 2014 | $3,991 | $63,580 | $11,970 | $51,610 |
| 2013 | $3,925 | $74,370 | $14,000 | $60,370 |
Source: Public Records
Map
Nearby Homes
- 7409 Wildberry Ct
- 7576 Lake Pointe
- 1123 Carrington Place
- 1491 Wexler Ct
- 1358 Brookchase Cir
- 7777 Swansong Cir
- 1247 Eagle Blvd
- 1255 Eagle Blvd
- 1204 Eagle Blvd
- 1180 Eagle Blvd
- 1544 Soaring Way
- 0 Zoar Rd Unit 1832052
- 0 Zoar Rd Unit 934288
- 7885 Wilderness Way
- 794 Owls Nest Ct
- 7000 Quellin Blvd
- 1497 Wexler Ct
- 1625 Kilbarron Dr
- 476 Haybrooke Dr
- 1978 Salt Run Way
- 1155 Bear Grass Way
- 1141 Bear Grass Way
- 1141 Beargrass Way
- 1165 Beargrass Way
- 1165 Bear Grass Way
- 1127 Bear Grass Way
- 1127 Beargrass Way
- 7439 Honeysuckle Ct
- 1148 Bear Grass Way
- 1174 Bear Grass Way
- 7416 Wildberry Ct
- 7433 Honeysuckle Ct
- 1177 Bear Grass Way
- 7410 Wildberry Ct
- 7438 Buttercup Ct
- 1113 Bear Grass Way
- 1113 Beargrass Way
- 1189 Beargrass Way
- 7440 Honeysuckle Ct
- 1189 Bear Grass Way
Your Personal Tour Guide
Ask me questions while you tour the home.