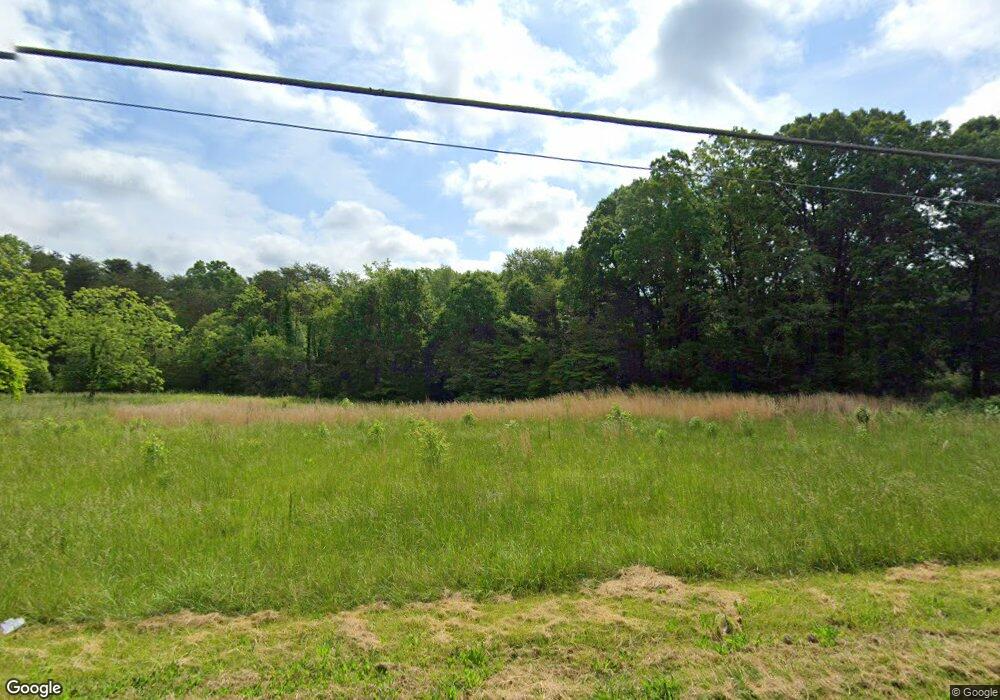
1155 Fairgrove Church Rd SE Conover, NC 28613
East Hickory NeighborhoodEstimated Value: $346,000 - $409,451
--
Bed
--
Bath
--
Sq Ft
2.79
Acres
About This Home
This home is located at 1155 Fairgrove Church Rd SE, Conover, NC 28613 and is currently estimated at $377,726. 1155 Fairgrove Church Rd SE is a home located in Catawba County with nearby schools including Webb A. Murray Elementary School, Saint Stephens High School, and Harry M. Arndt Middle School.
Ownership History
Date
Name
Owned For
Owner Type
Purchase Details
Closed on
Dec 12, 2016
Sold by
Holsclaw Tracy Darian and Holsclaw Timothy Dean
Bought by
Proctor Proctor H and Proctor Brenda B
Current Estimated Value
Purchase Details
Closed on
Nov 10, 2016
Sold by
Fleming Clay S and Fleming Teresa Ann
Bought by
Proctor H Dean
Purchase Details
Closed on
Jan 29, 2013
Sold by
Fleming Arthur Newbern and Revocable Declaration Of Trust
Bought by
Fleming Arthur Newbern
Purchase Details
Closed on
Apr 2, 2009
Sold by
Fleming Margie and Fleming Margie F
Bought by
Fleming Arthur Newbern and Revocable Declaration Of Trust
Purchase Details
Closed on
Sep 2, 1966
Sold by
Fleming Arthur Newbern
Bought by
Fleming Arthur Newbern
Purchase Details
Closed on
Sep 15, 1964
Bought by
Fleming Arthur Newbern and Fleming Margi
Create a Home Valuation Report for This Property
The Home Valuation Report is an in-depth analysis detailing your home's value as well as a comparison with similar homes in the area
Home Values in the Area
Average Home Value in this Area
Purchase History
| Date | Buyer | Sale Price | Title Company |
|---|---|---|---|
| Proctor Proctor H | $150,000 | None Available | |
| Proctor H Dean | $193,500 | None Available | |
| Fleming Arthur Newbern | -- | None Available | |
| Fleming Arthur Newbern | -- | None Available | |
| Fleming Arthur Newbern | -- | None Available | |
| Fleming Arthur Newbern | $3,300 | -- | |
| Fleming Arthur Newbern | $5,500 | -- |
Source: Public Records
Mortgage History
| Date | Status | Borrower | Loan Amount |
|---|---|---|---|
| Closed | Fleming Arthur Newbern | $0 |
Source: Public Records
Tax History Compared to Growth
Tax History
| Year | Tax Paid | Tax Assessment Tax Assessment Total Assessment is a certain percentage of the fair market value that is determined by local assessors to be the total taxable value of land and additions on the property. | Land | Improvement |
|---|---|---|---|---|
| 2025 | $2,097 | $245,700 | $245,700 | $0 |
| 2024 | $2,097 | $245,700 | $245,700 | $0 |
| 2023 | $2,097 | $245,700 | $245,700 | $0 |
| 2022 | $2,661 | $221,300 | $221,300 | $0 |
| 2021 | $2,704 | $224,900 | $224,900 | $0 |
| 2020 | $2,614 | $224,900 | $0 | $0 |
| 2019 | $2,614 | $224,900 | $0 | $0 |
| 2018 | $0 | $267,400 | $267,400 | $0 |
| 2017 | $3,201 | $0 | $0 | $0 |
| 2016 | $3,189 | $0 | $0 | $0 |
| 2015 | $3,832 | $279,400 | $266,400 | $13,000 |
| 2014 | $3,832 | $372,000 | $350,400 | $21,600 |
Source: Public Records
Map
Nearby Homes
- 1275 32nd St SE
- 1351 33rd St SE
- 3045 8th Ave SE
- 320 Fairgrove Church Rd SE
- 1510 31st Street Ct SE
- 3362 15th Avenue Blvd SE
- 1221 Fedex Dr SW Unit 2
- 3318 Danial St
- 350 Spencer Rd NE
- 3395 Danial St
- 1530 29th St SE
- 1524 29th St SE
- 0000 Section House Rd
- 3233 6th Ave NE
- V/L 33rd St NE Unit 15
- 2761 Highland Ave NE
- 0 Short Rd
- 2792 5th Ave NE
- 952 30th St NE
- 0 St Pauls Church Rd Unit CAR4299390
- 1173 Fairgrove Church Rd SE
- 1125 Fairgrove Church Rd SE
- 1211 Fairgrove Church Rd SE
- 1209 Fairgrove Church Rd SE
- 3530 Graystone Place SE
- 3305 12th Avenue Place SE
- 3230 12th Ave SE
- 3231 12th Avenue Place SE
- 3210 12th Ave SE
- 00 Graystone Place SE Unit 2
- 0 Fairgrove Church Rd SE
- 00 Greystone Place Rd Unit 2
- 3221 12th Avenue Place SE
- 3186 12th Ave SE
- 3250 12th Avenue Place SE
- 3250 12th Avenue Place SE Unit 1B
- 3179 12th Ave SE
- 1305 33rd St SE
- 3178 12th Ave SE
- 1265 32nd St SE