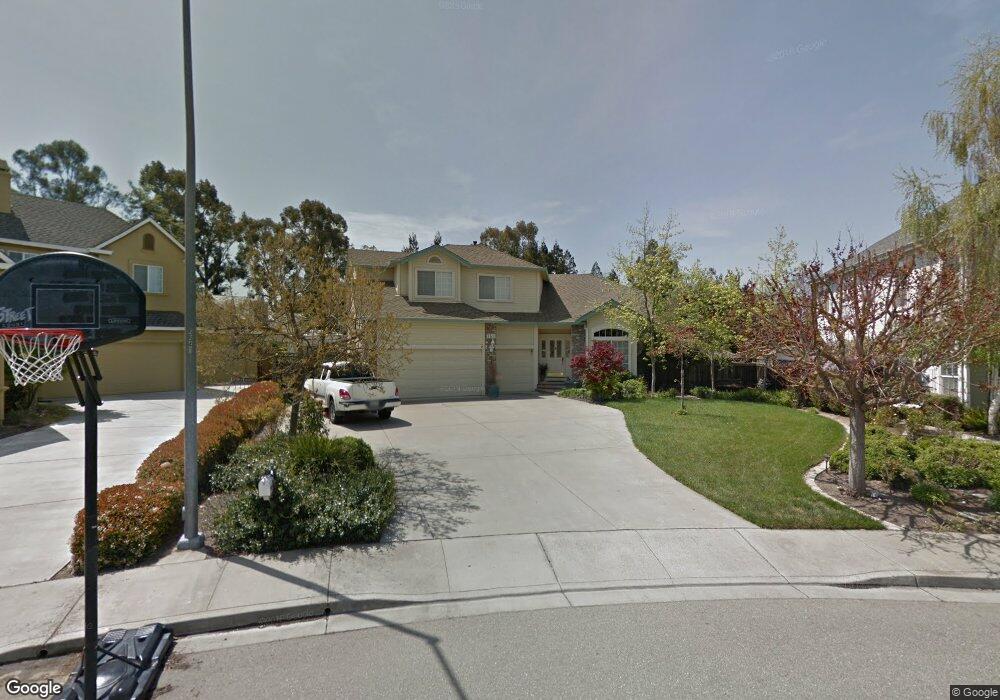
1155 Riesling Cir Livermore, CA 94550
Estimated Value: $1,591,000 - $1,779,000
4
Beds
3
Baths
2,708
Sq Ft
$631/Sq Ft
Est. Value
About This Home
This home is located at 1155 Riesling Cir, Livermore, CA 94550 and is currently estimated at $1,708,669, approximately $630 per square foot. 1155 Riesling Cir is a home located in Alameda County with nearby schools including East Avenue Middle School, Livermore High School, and Our Savior Lutheran.
Ownership History
Date
Name
Owned For
Owner Type
Purchase Details
Closed on
Dec 30, 2019
Sold by
Berry Lane
Bought by
Berry Polash Elizabeth
Current Estimated Value
Purchase Details
Closed on
Dec 1, 2014
Sold by
Bonlie James D and Bonlie Gail
Bought by
Bonlie Family Trust
Purchase Details
Closed on
Jan 19, 1999
Sold by
Murphy Jeffrey J and Murphy Debra A
Bought by
Bonlie James D and Bonlie Gail
Home Financials for this Owner
Home Financials are based on the most recent Mortgage that was taken out on this home.
Original Mortgage
$360,000
Interest Rate
6.63%
Create a Home Valuation Report for This Property
The Home Valuation Report is an in-depth analysis detailing your home's value as well as a comparison with similar homes in the area
Purchase History
| Date | Buyer | Sale Price | Title Company |
|---|---|---|---|
| Berry Polash Elizabeth | -- | Chicago Title Company | |
| Berry Polash Elizabeth | $1,290,000 | Chicago Title Company | |
| Bonlie Family Trust | -- | None Available | |
| Bonlie James D | $480,000 | Old Republic Title Company |
Source: Public Records
Mortgage History
| Date | Status | Borrower | Loan Amount |
|---|---|---|---|
| Previous Owner | Bonlie James D | $360,000 |
Source: Public Records
Tax History
| Year | Tax Paid | Tax Assessment Tax Assessment Total Assessment is a certain percentage of the fair market value that is determined by local assessors to be the total taxable value of land and additions on the property. | Land | Improvement |
|---|---|---|---|---|
| 2025 | $16,844 | $1,410,782 | $492,133 | $918,649 |
| 2024 | $16,844 | $1,383,124 | $482,485 | $900,639 |
| 2023 | $16,624 | $1,356,008 | $473,026 | $882,982 |
| 2022 | $16,414 | $1,329,422 | $463,752 | $865,670 |
| 2021 | $15,361 | $1,303,364 | $454,662 | $848,702 |
| 2020 | $8,726 | $688,036 | $206,411 | $481,625 |
| 2019 | $8,764 | $674,548 | $202,364 | $472,184 |
| 2018 | $8,580 | $661,324 | $198,397 | $462,927 |
| 2017 | $8,362 | $648,360 | $194,508 | $453,852 |
| 2016 | $8,058 | $635,648 | $190,694 | $444,954 |
| 2015 | $7,558 | $626,101 | $187,830 | $438,271 |
| 2014 | $7,427 | $613,837 | $184,151 | $429,686 |
Source: Public Records
Map
Nearby Homes
- 1113 Tokay Common
- 2726 Chateau Way
- 2513 Chateau Way
- 2290 Chateau Way
- 2342 Palm Ave
- 2211 College Ave
- 772 Mcleod St
- 820 Arbor Ct
- 3734 Carrigan Common
- 874 Mendenhall Dr
- 1166 Killarney St
- 2235 4th St
- 843 Jensen St
- 1500 Arroyo Rd
- 1766 College Ave
- 1148 Hillcrest Ct
- 2170 Santa Croce Dr
- 3797 Oregon Way
- 3817 Stanford Way
- 575 S O St
- 1167 Riesling Cir
- 1153 Riesling Cir
- 1137 Tokay Common
- 1145 Tokay Common
- 2718 Chablis Way
- 2686 Chablis Way
- 2752 Chablis Way
- 1141 Riesling Cir
- 1149 Tokay Common
- 1144 Riesling Cir
- 1215 S Tokay Cm Ave
- 1151 Tokay Common
- 1138 Riesling Cir
- 2790 Chablis Way
- 1129 Riesling Cir
- 1191 Riesling Cir
- 1125 Tokay Common
- 2654 Chablis Way
- 1197 Sherry Way
- 1196 Sherry Way
Your Personal Tour Guide
Ask me questions while you tour the home.