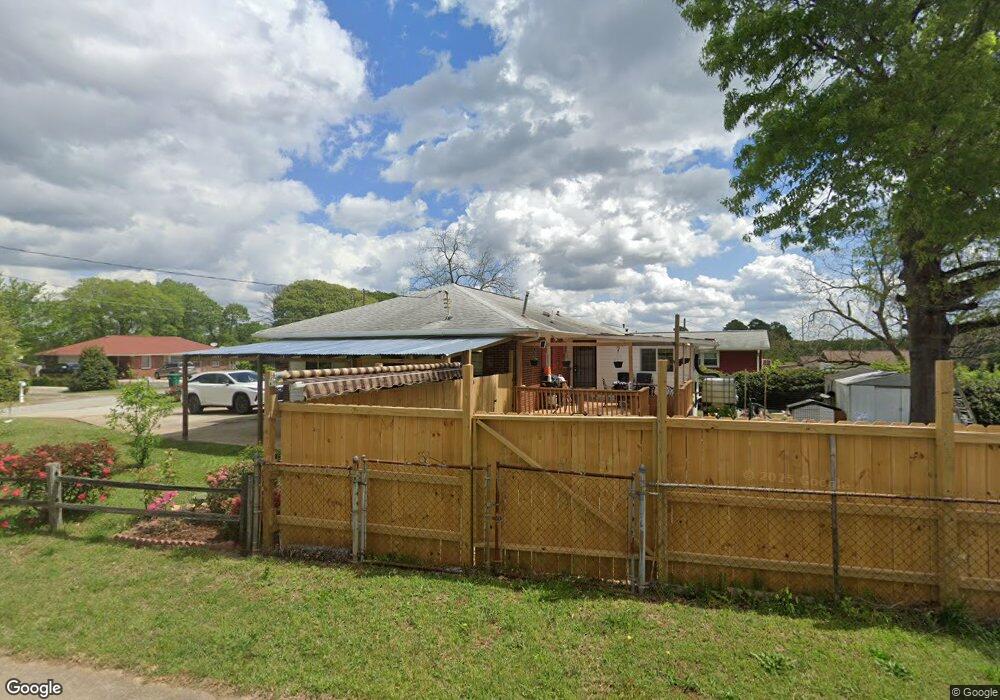
1155 Sanders Way Morrow, GA 30260
Estimated Value: $215,008 - $270,000
3
Beds
2
Baths
1,124
Sq Ft
$216/Sq Ft
Est. Value
About This Home
This home is located at 1155 Sanders Way, Morrow, GA 30260 and is currently estimated at $242,504, approximately $215 per square foot. 1155 Sanders Way is a home located in Clayton County with nearby schools including Lake City Elementary School, Babb Middle School, and Forest Park High School.
Ownership History
Date
Name
Owned For
Owner Type
Purchase Details
Closed on
Jul 8, 2016
Sold by
Huynh Phuong T
Bought by
Tran Dung A and Nguyen Xuan T
Current Estimated Value
Home Financials for this Owner
Home Financials are based on the most recent Mortgage that was taken out on this home.
Original Mortgage
$66,600
Outstanding Balance
$53,201
Interest Rate
3.6%
Mortgage Type
New Conventional
Estimated Equity
$189,303
Purchase Details
Closed on
Jun 16, 2014
Sold by
Ford Martin J
Bought by
Hyunh Phuong Thi
Purchase Details
Closed on
Apr 30, 2014
Sold by
Ford William Gordon
Bought by
Ford Martin J
Purchase Details
Closed on
Aug 25, 1994
Sold by
Schwab B E
Bought by
Ford Donald C Martin
Home Financials for this Owner
Home Financials are based on the most recent Mortgage that was taken out on this home.
Original Mortgage
$58,793
Interest Rate
8.74%
Mortgage Type
FHA
Create a Home Valuation Report for This Property
The Home Valuation Report is an in-depth analysis detailing your home's value as well as a comparison with similar homes in the area
Home Values in the Area
Average Home Value in this Area
Purchase History
| Date | Buyer | Sale Price | Title Company |
|---|---|---|---|
| Tran Dung A | $74,000 | -- | |
| Hyunh Phuong Thi | $37,000 | -- | |
| Ford Martin J | -- | -- | |
| Ford Martin J | -- | -- | |
| Ford Donald C Martin | $60,000 | -- |
Source: Public Records
Mortgage History
| Date | Status | Borrower | Loan Amount |
|---|---|---|---|
| Open | Tran Dung A | $66,600 | |
| Previous Owner | Ford Donald C Martin | $58,793 |
Source: Public Records
Tax History Compared to Growth
Tax History
| Year | Tax Paid | Tax Assessment Tax Assessment Total Assessment is a certain percentage of the fair market value that is determined by local assessors to be the total taxable value of land and additions on the property. | Land | Improvement |
|---|---|---|---|---|
| 2024 | $2,965 | $89,400 | $6,400 | $83,000 |
| 2023 | $3,228 | $89,400 | $6,400 | $83,000 |
| 2022 | $2,948 | $75,120 | $6,400 | $68,720 |
| 2021 | $1,327 | $33,600 | $6,400 | $27,200 |
| 2020 | $1,236 | $30,894 | $6,400 | $24,494 |
| 2019 | $1,272 | $31,333 | $5,200 | $26,133 |
| 2018 | $1,277 | $31,457 | $5,200 | $26,257 |
| 2017 | $1,011 | $24,851 | $5,200 | $19,651 |
| 2016 | $758 | $21,246 | $5,200 | $16,046 |
| 2015 | $518 | $0 | $0 | $0 |
| 2014 | $468 | $23,428 | $5,200 | $18,228 |
Source: Public Records
Map
Nearby Homes
- 1207 Ellington Dr
- 1167 Sanders Dr
- 5474 Ahyoka Dr
- 1341 Kenyon Rd
- 5131 Warner St
- 98 Werner Brook Way SW
- 5446 Alder Dr
- 0 Ash St Unit 10563129
- 5626 Cypress Dr
- 5355 Sharon St
- 5570 Ash St
- 753 Glenn Dr
- 791 Alice St
- 774 Virginia Cir Unit 2
- 5690 Cypress Dr
- 5288 Lee Cir
- 1638 Dellwood Cir
- 5310 Lyndale Cir
- 718 South Ave
- 990 Finley Dr
- 1163 Sanders Way
- 5353 Sanders Rd
- 5375 Sanders Rd
- 1171 Sanders Way
- 1154 Sanders Way
- 1162 Sanders Way
- 1170 Sanders Way
- 1179 Sanders Way Unit 2
- 1178 Sanders Way
- 1187 Sanders Way
- 1186 Sanders Way Unit 2
- 1163 Ellington Dr
- 1155 Ellington Dr
- 1171 Ellington Dr
- 1195 Sanders Way Unit 2
- 1179 Ellington Dr
- 1194 Sanders Way Unit 2
- 1187 Ellington Dr
- 1201 Sanders Way
- 1195 Ellington Dr