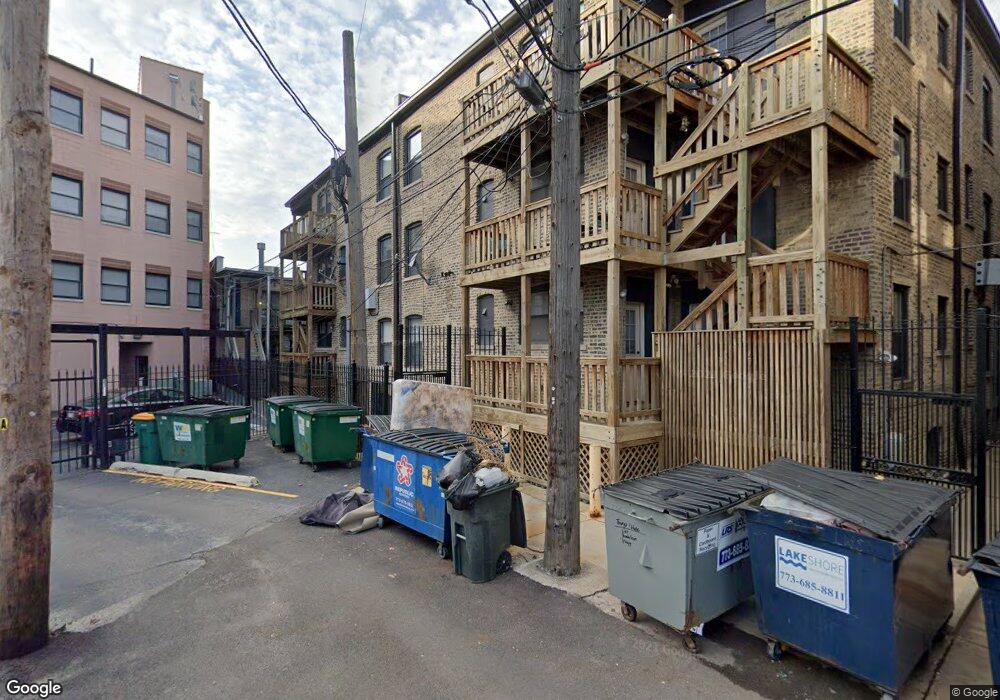
1155 W Grace St Unit 11551S Chicago, IL 60613
Wrigleyville NeighborhoodEstimated Value: $266,000 - $367,000
1
Bed
1
Bath
--
Sq Ft
0.45
Acres
About This Home
This home is located at 1155 W Grace St Unit 11551S, Chicago, IL 60613 and is currently estimated at $305,028. 1155 W Grace St Unit 11551S is a home located in Cook County with nearby schools including Blaine Elementary School, Lake View High School, and Bernard Zell Anshe Emet Day School.
Ownership History
Date
Name
Owned For
Owner Type
Purchase Details
Closed on
Jun 12, 2017
Sold by
Muszynski Thomas J and Muszynski Kirsten Orvick
Bought by
Phillips Caroline
Current Estimated Value
Home Financials for this Owner
Home Financials are based on the most recent Mortgage that was taken out on this home.
Original Mortgage
$200,000
Outstanding Balance
$166,812
Interest Rate
4.12%
Mortgage Type
Construction
Estimated Equity
$138,216
Purchase Details
Closed on
Dec 8, 2010
Sold by
Orvick Kirsten L and Muszynski Kirsten Orvick
Bought by
Muszynski Thomas J and Muszynski Kirsten Orvick
Purchase Details
Closed on
Dec 23, 2003
Sold by
Grace & Racine Llc
Bought by
Orvick Kirsten L
Home Financials for this Owner
Home Financials are based on the most recent Mortgage that was taken out on this home.
Original Mortgage
$187,750
Interest Rate
5.91%
Mortgage Type
Balloon
Create a Home Valuation Report for This Property
The Home Valuation Report is an in-depth analysis detailing your home's value as well as a comparison with similar homes in the area
Home Values in the Area
Average Home Value in this Area
Purchase History
| Date | Buyer | Sale Price | Title Company |
|---|---|---|---|
| Phillips Caroline | $222,500 | Chicago Title | |
| Muszynski Thomas J | -- | None Available | |
| Orvick Kirsten L | $235,000 | Ticor Title Insurance Co |
Source: Public Records
Mortgage History
| Date | Status | Borrower | Loan Amount |
|---|---|---|---|
| Open | Phillips Caroline | $200,000 | |
| Previous Owner | Orvick Kirsten L | $187,750 | |
| Closed | Orvick Kirsten L | $23,400 |
Source: Public Records
Tax History Compared to Growth
Tax History
| Year | Tax Paid | Tax Assessment Tax Assessment Total Assessment is a certain percentage of the fair market value that is determined by local assessors to be the total taxable value of land and additions on the property. | Land | Improvement |
|---|---|---|---|---|
| 2024 | $4,642 | $22,800 | $7,009 | $15,791 |
| 2023 | $4,525 | $22,000 | $5,653 | $16,347 |
| 2022 | $4,525 | $22,000 | $5,653 | $16,347 |
| 2021 | $4,424 | $21,999 | $5,652 | $16,347 |
| 2020 | $4,201 | $18,857 | $2,411 | $16,446 |
| 2019 | $4,127 | $20,541 | $2,411 | $18,130 |
| 2018 | $4,058 | $20,541 | $2,411 | $18,130 |
| 2017 | $4,109 | $19,088 | $2,110 | $16,978 |
| 2016 | $3,823 | $19,088 | $2,110 | $16,978 |
| 2015 | $3,498 | $19,088 | $2,110 | $16,978 |
| 2014 | $3,405 | $18,351 | $1,724 | $16,627 |
| 2013 | $3,338 | $18,351 | $1,724 | $16,627 |
Source: Public Records
Map
Nearby Homes
- 3811 N Alta Vista Terrace
- 3837 N Alta Vista Terrace
- 3809 N Kenmore Ave
- 3765 N Kenmore Ave
- 3719 N Magnolia Ave
- 1050 W Dakin St Unit G2
- 3920 N Sheridan Rd Unit 508
- 3750 N Wilton Ave Unit 5
- 1124 W Addison St Unit 1
- 1124 W Addison St Unit 2
- 3807 N Wilton Ave Unit 3
- 1134 W Addison St
- 3723 N Wilton Ave Unit 4
- 3760 N Wayne Ave
- 3810 N Fremont St Unit 2B
- 3758 N Fremont St Unit 2
- 3758 N Fremont St Unit 1
- 3826 N Fremont St Unit 1N
- 1123 W Addison St
- 4038 N Kenmore Ave Unit 2
- 1153 W Grace St Unit 2N
- 1157 W Grace St Unit 3S
- 1141 W Grace St Unit 1N
- 1157 W Grace St Unit 11572S
- 1153 W Grace St Unit 11533N
- 1141 W Grace St Unit 11412N
- 1133 W Grace St Unit 11331N
- 1153 W Grace St Unit 11533S
- 1155 W Grace St Unit 11552N
- 1153 W Grace St Unit 11531N
- 1155 W Grace St Unit 11553N
- 1135 W Grace St Unit 11351N
- 1141 W Grace St Unit 11413N
- 1157 W Grace St Unit 11571N
- 1133 W Grace St Unit 11332N
- 1135 W Grace St Unit 11352S
- 1135 W Grace St Unit 11353S
- 1157 W Grace St Unit 11573N
- 1133 W Grace St Unit 1133G
- 1157 W Grace St Unit 11571S