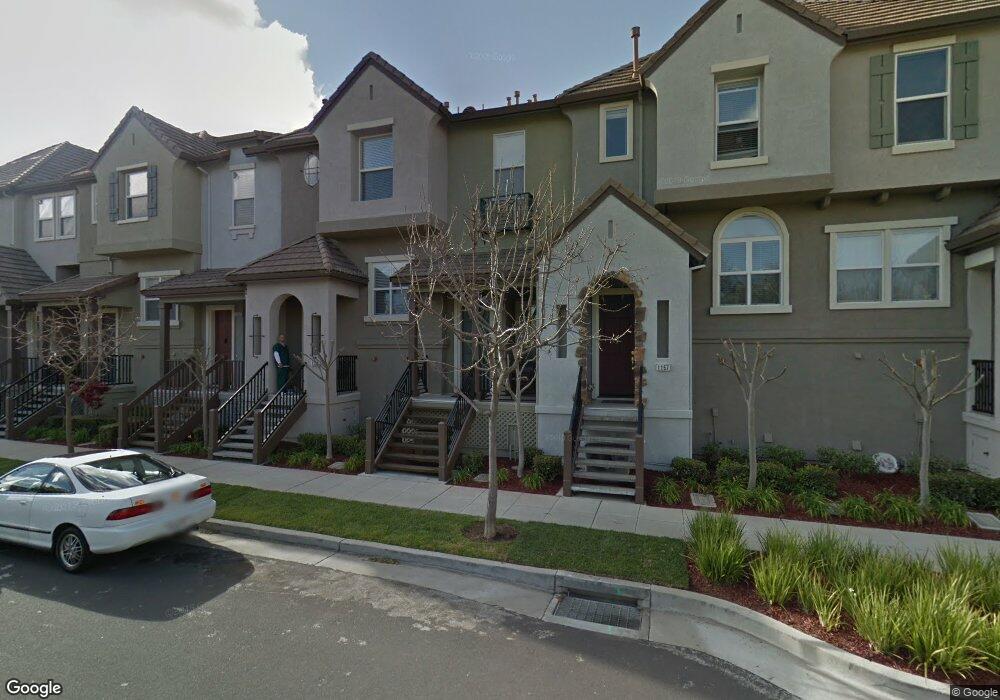
1155 Yates Way Unit U5913 San Mateo, CA 94403
Hillsdale NeighborhoodEstimated Value: $1,158,000 - $1,562,000
3
Beds
3
Baths
1,312
Sq Ft
$962/Sq Ft
Est. Value
About This Home
This home is located at 1155 Yates Way Unit U5913, San Mateo, CA 94403 and is currently estimated at $1,262,673, approximately $962 per square foot. 1155 Yates Way Unit U5913 is a home located in San Mateo County with nearby schools including George Hall Elementary School, Abbott Middle School, and Hillsdale High School.
Ownership History
Date
Name
Owned For
Owner Type
Purchase Details
Closed on
May 19, 2008
Sold by
Buenaventura Gil
Bought by
Buenaventura Gil and Buenaventura Jane C
Current Estimated Value
Purchase Details
Closed on
Apr 9, 2004
Sold by
Munjal Deepak
Bought by
Buenaventura Gil
Home Financials for this Owner
Home Financials are based on the most recent Mortgage that was taken out on this home.
Original Mortgage
$430,500
Outstanding Balance
$201,315
Interest Rate
5.57%
Mortgage Type
Stand Alone First
Estimated Equity
$1,061,358
Purchase Details
Closed on
Sep 9, 2003
Sold by
Buenaventura Jane C
Bought by
Buenaventura Gil
Purchase Details
Closed on
Mar 7, 2002
Sold by
Pang Elton and Huang Sophie Fei Sung
Bought by
Munjal Deepak and Munjal Ena
Create a Home Valuation Report for This Property
The Home Valuation Report is an in-depth analysis detailing your home's value as well as a comparison with similar homes in the area
Home Values in the Area
Average Home Value in this Area
Purchase History
| Date | Buyer | Sale Price | Title Company |
|---|---|---|---|
| Buenaventura Gil | -- | None Available | |
| Buenaventura Gil | $615,000 | Chicago Title Co | |
| Buenaventura Gil | -- | Chicago Title Co | |
| Munjal Deepak | $525,000 | First American Title Co |
Source: Public Records
Mortgage History
| Date | Status | Borrower | Loan Amount |
|---|---|---|---|
| Open | Buenaventura Gil | $430,500 |
Source: Public Records
Tax History Compared to Growth
Tax History
| Year | Tax Paid | Tax Assessment Tax Assessment Total Assessment is a certain percentage of the fair market value that is determined by local assessors to be the total taxable value of land and additions on the property. | Land | Improvement |
|---|---|---|---|---|
| 2025 | $11,410 | $874,381 | $262,309 | $612,072 |
| 2023 | $11,410 | $840,429 | $252,124 | $588,305 |
| 2022 | $10,762 | $823,951 | $247,181 | $576,770 |
| 2021 | $10,535 | $807,796 | $242,335 | $565,461 |
| 2020 | $10,079 | $799,514 | $239,851 | $559,663 |
| 2019 | $9,700 | $783,839 | $235,149 | $548,690 |
| 2018 | $9,174 | $768,471 | $230,539 | $537,932 |
| 2017 | $8,925 | $753,404 | $226,019 | $527,385 |
| 2016 | $8,586 | $738,633 | $221,588 | $517,045 |
| 2015 | $8,637 | $727,539 | $218,260 | $509,279 |
| 2014 | $8,500 | $713,288 | $213,985 | $499,303 |
Source: Public Records
Map
Nearby Homes
- 2876 Saratoga Dr
- 2736 Foster St
- 133 Waters Park Cir
- 2835 Alvarado Ave
- 475 Landeros Dr
- 406 E 28th Ave
- 2868 Baze Rd
- 1573 Marina Ct Unit A
- 367 Derby Ave
- 1640 Marina Ct Unit F
- 413 Franklin Pkwy
- 3015 Los Prados St Unit 114
- 3001 Los Prados St Unit 104
- 3513 Casanova Dr
- 1928 Vista Cay
- 740 Promontory Point Ln Unit 3109
- 3045 Los Prados St Unit 218
- 706 Celestial Ln
- 1542 Vista Del Sol
- 739 Aries Ln
- 1145 Yates Way Unit U5908
- 1137 Yates Way
- 1151 Yates Way Unit U5911
- 1149 Yates Way
- 1147 Yates Way Unit U5909
- 1143 Yates Way Unit U5907
- 1135 Yates Way Unit U5903
- 1157 Yates Way
- 1141 Yates Way Unit U5906
- 1139 Yates Way Unit U5905
- 1133 Yates Way
- 1131 Yates Way Unit U5901
- 1159 Yates Way Unit U5915
- 1153 Yates Way Unit U5912
- 1140 Wayne Way
- 1136 Wayne Way
- 1144 Wayne Way
- 1132 Wayne Way
- 1148 Wayne Way
- 1128 Wayne Way