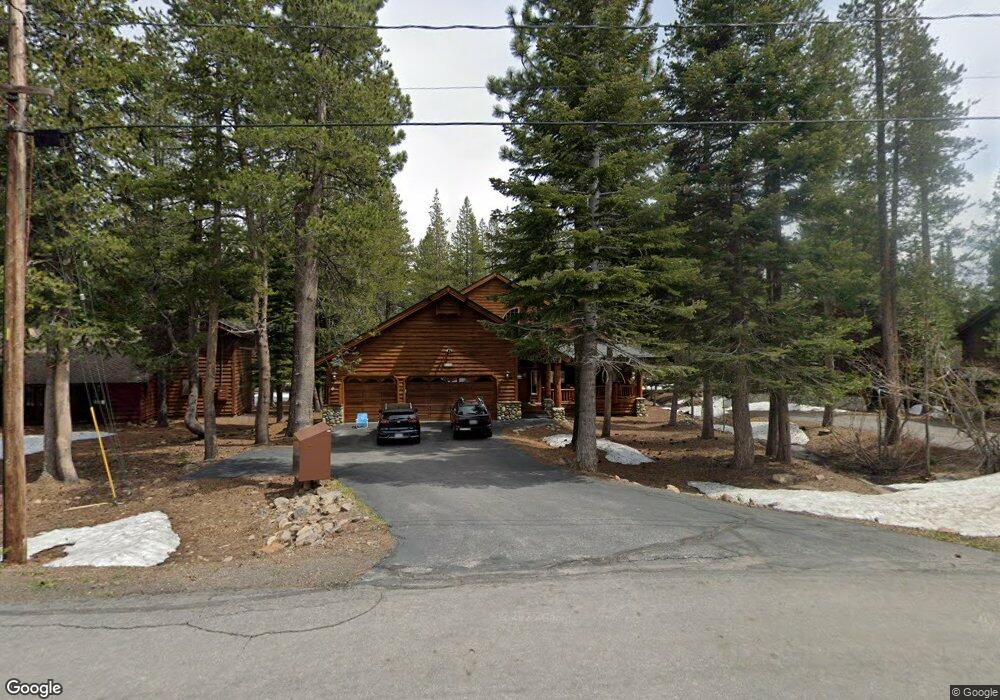
11554 Chalet Rd Unit 11 Truckee, CA 96161
Tahoe Donner NeighborhoodEstimated Value: $1,903,000 - $2,056,000
4
Beds
4
Baths
3,389
Sq Ft
$581/Sq Ft
Est. Value
About This Home
This home is located at 11554 Chalet Rd Unit 11, Truckee, CA 96161 and is currently estimated at $1,968,018, approximately $580 per square foot. 11554 Chalet Rd Unit 11 is a home located in Nevada County with nearby schools including Truckee Elementary School, Alder Creek Middle School, and Tahoe Truckee High School.
Ownership History
Date
Name
Owned For
Owner Type
Purchase Details
Closed on
Aug 1, 2018
Sold by
Pritchard John S and Pritchard Holly E
Bought by
Pritchard John S and Pritchard Holly E
Current Estimated Value
Purchase Details
Closed on
Apr 27, 2011
Sold by
Galten Douglas H and Galten Diane A
Bought by
Pritchard John S and Pritchard Holly E
Purchase Details
Closed on
Apr 18, 2002
Sold by
Galten Douglas H and Galten Diane A
Bought by
Galten Douglas H and Galten Diane A
Home Financials for this Owner
Home Financials are based on the most recent Mortgage that was taken out on this home.
Original Mortgage
$500,000
Interest Rate
7.08%
Mortgage Type
Credit Line Revolving
Create a Home Valuation Report for This Property
The Home Valuation Report is an in-depth analysis detailing your home's value as well as a comparison with similar homes in the area
Home Values in the Area
Average Home Value in this Area
Purchase History
| Date | Buyer | Sale Price | Title Company |
|---|---|---|---|
| Pritchard John S | $320,000 | None Available | |
| Pritchard John S | $827,000 | First American Title Company | |
| Galten Douglas H | -- | North American Title Co | |
| Galten Douglas H | -- | North American Title Co |
Source: Public Records
Mortgage History
| Date | Status | Borrower | Loan Amount |
|---|---|---|---|
| Previous Owner | Galten Douglas H | $500,000 |
Source: Public Records
Tax History Compared to Growth
Tax History
| Year | Tax Paid | Tax Assessment Tax Assessment Total Assessment is a certain percentage of the fair market value that is determined by local assessors to be the total taxable value of land and additions on the property. | Land | Improvement |
|---|---|---|---|---|
| 2025 | $12,696 | $1,060,493 | $321,261 | $739,232 |
| 2024 | $12,606 | $1,039,700 | $314,962 | $724,738 |
| 2023 | $12,606 | $1,019,315 | $308,787 | $710,528 |
| 2022 | $12,302 | $999,330 | $302,733 | $696,597 |
| 2021 | $11,807 | $979,678 | $296,739 | $682,939 |
| 2020 | $11,738 | $969,634 | $293,697 | $675,937 |
| 2019 | $11,768 | $950,623 | $287,939 | $662,684 |
| 2018 | $11,043 | $931,985 | $282,294 | $649,691 |
| 2017 | $10,826 | $913,713 | $276,761 | $636,952 |
| 2016 | $10,746 | $895,027 | $270,564 | $624,463 |
| 2015 | $10,499 | $881,583 | $266,500 | $615,083 |
| 2014 | $10,070 | $864,315 | $261,280 | $603,035 |
Source: Public Records
Map
Nearby Homes
- 11539 Chalet Rd
- 14450 Swiss Ln
- 13345 Skiview Loop
- 14270 Swiss Ln
- 14246 Swiss Ln
- 14579 Northwoods Blvd
- 12851 Ski View Loop Unit 11
- 11926 Rhineland Ave
- 11939 Rhineland Ave
- 14344 Northwoods Blvd
- 14005 Swiss Ln
- 14924 Northwoods Blvd
- 13257 Ski Slope Way
- 13038 Ski Slope Way
- 14487 Ski Slope Way
- 11566 Rhineland Ave
- 14207 Northwoods Blvd
- 13180 Ski Slope Way
- 14004 Ramshorn St
- 15040 Davos Dr
- 11554 Chalet Rd
- 11540 Chalet Rd
- 11566 Chalet Rd
- 11526 Chalet Rd
- 11580 Chalet Rd
- 11567 Chalet Rd
- 11539 Chalet Rd Unit 11
- 11592 Chalet Rd
- 11525 Chalet Rd
- 11500 Chalet Rd
- 11511 Chalet Rd
- 11604 Chalet Rd
- 11604 Chalet Rd Unit 11
- 11739 Chateau Way
- 11488 Chalet Rd
- 11499 Chalet Rd
- 11616 Chalet Rd
- 11751 Chateau Way
- 11487 Chalet Rd
- 11765 Chateau Way