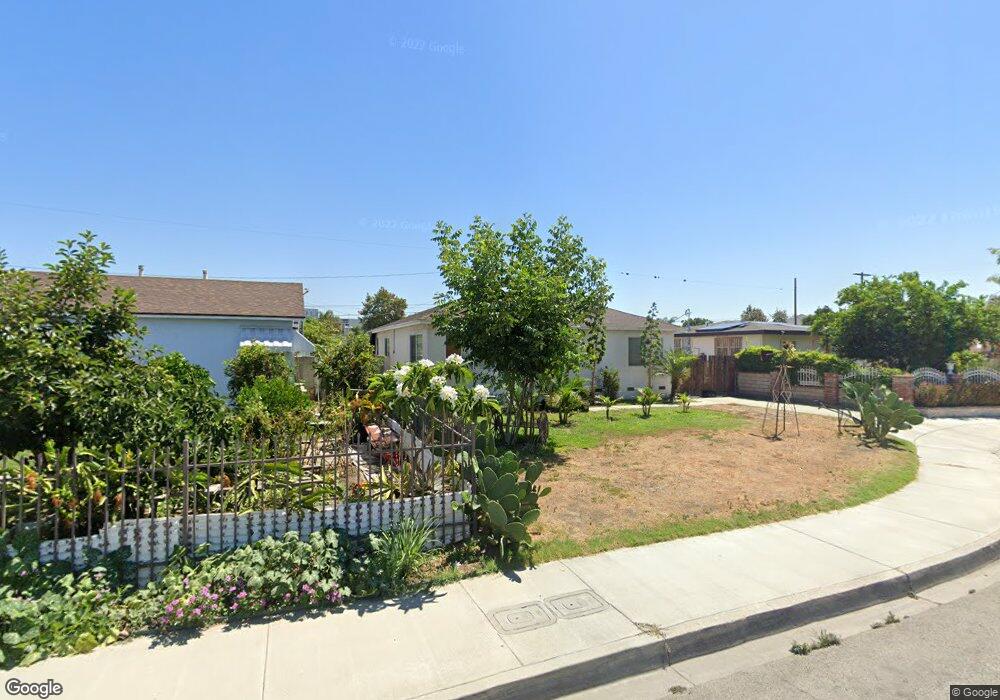
11559 Fennell St El Monte, CA 91732
Mountain View NeighborhoodEstimated Value: $638,000 - $706,465
3
Beds
1
Bath
1,029
Sq Ft
$653/Sq Ft
Est. Value
About This Home
This home is located at 11559 Fennell St, El Monte, CA 91732 and is currently estimated at $671,866, approximately $652 per square foot. 11559 Fennell St is a home located in Los Angeles County with nearby schools including Baker Elementary, El Monte High School, and New Life Christian School.
Ownership History
Date
Name
Owned For
Owner Type
Purchase Details
Closed on
May 11, 2009
Sold by
Deutsche Bank National Trust Company
Bought by
Wong William D and Wong Karena K
Current Estimated Value
Purchase Details
Closed on
Dec 15, 2008
Sold by
Garcia Pablo
Bought by
Deutsche Bank National Trust Company
Purchase Details
Closed on
Jul 17, 2006
Sold by
Garcia Gloria
Bought by
Garcia Pablo A
Home Financials for this Owner
Home Financials are based on the most recent Mortgage that was taken out on this home.
Original Mortgage
$372,000
Interest Rate
7.85%
Mortgage Type
Balloon
Purchase Details
Closed on
Mar 6, 1998
Sold by
Parker Deanna C and Parker Richard
Bought by
Parker Richard and Parker Irene
Home Financials for this Owner
Home Financials are based on the most recent Mortgage that was taken out on this home.
Original Mortgage
$91,000
Interest Rate
6.5%
Create a Home Valuation Report for This Property
The Home Valuation Report is an in-depth analysis detailing your home's value as well as a comparison with similar homes in the area
Home Values in the Area
Average Home Value in this Area
Purchase History
| Date | Buyer | Sale Price | Title Company |
|---|---|---|---|
| Wong William D | $243,000 | First American Title Company | |
| Deutsche Bank National Trust Company | $378,334 | None Available | |
| Garcia Pablo A | -- | Financial Title Company | |
| Garcia Pablo A | $465,000 | Financial Title Company | |
| Parker Richard | $45,000 | Southland Title |
Source: Public Records
Mortgage History
| Date | Status | Borrower | Loan Amount |
|---|---|---|---|
| Previous Owner | Garcia Pablo A | $372,000 | |
| Previous Owner | Parker Richard | $91,000 |
Source: Public Records
Tax History Compared to Growth
Tax History
| Year | Tax Paid | Tax Assessment Tax Assessment Total Assessment is a certain percentage of the fair market value that is determined by local assessors to be the total taxable value of land and additions on the property. | Land | Improvement |
|---|---|---|---|---|
| 2025 | $4,600 | $320,524 | $186,072 | $134,452 |
| 2024 | $4,600 | $314,240 | $182,424 | $131,816 |
| 2023 | $4,525 | $308,080 | $178,848 | $129,232 |
| 2022 | $4,354 | $302,041 | $175,342 | $126,699 |
| 2021 | $4,456 | $296,119 | $171,904 | $124,215 |
| 2019 | $4,414 | $287,338 | $166,806 | $120,532 |
| 2018 | $4,136 | $281,705 | $163,536 | $118,169 |
| 2016 | $3,817 | $270,768 | $157,187 | $113,581 |
| 2015 | $3,776 | $266,701 | $154,826 | $111,875 |
| 2014 | $3,699 | $261,478 | $151,794 | $109,684 |
Source: Public Records
Map
Nearby Homes
- 3114 Peck Rd
- 11408 Garvey Ave
- 2821 Musgrove Ave
- 3361 Meeker Ave
- 3457 Whistler Ave
- 11433 Stewart St
- 2908 Cogswell Rd
- 2826 Cogswell Rd Unit A-M
- 3032 Cogswell Rd
- 2709 Cogswell Rd Unit B
- 2709 Cogswell Rd Unit D
- 2709 Cogswell Rd Unit A
- 2709 Cogswell Rd Unit C
- 11331 Elliott Ave Unit 21
- 2707 Peck Rd
- 3528 La Madera Ave
- 11663 Sitka St Unit F
- 11131 Dodson St Unit 7
- 11670 Ferris Rd
- 3551 Whistler Ave Unit 11
- 11555 Fennell St
- 11563 Fennell St
- 11549 Fennell St
- 3128 Richwood Ave
- 11543 Fennell St
- 11556 Fennell St
- 3120 Richwood Ave
- 11548 Fennell St
- 11539 Fennell St
- 3114 Richwood Ave
- 3139 La Madera Ave
- 3133 La Madera Ave
- 3127 La Madera Ave
- 11538 Fennell St
- 3145 La Madera Ave
- 11533 Fennell St
- 3121 La Madera Ave
- 11559 Asher St
- 11601 Asher St
- 11549 Asher St