Estimated Value: $1,046,000 - $1,265,000
4
Beds
3
Baths
4,830
Sq Ft
$236/Sq Ft
Est. Value
About This Home
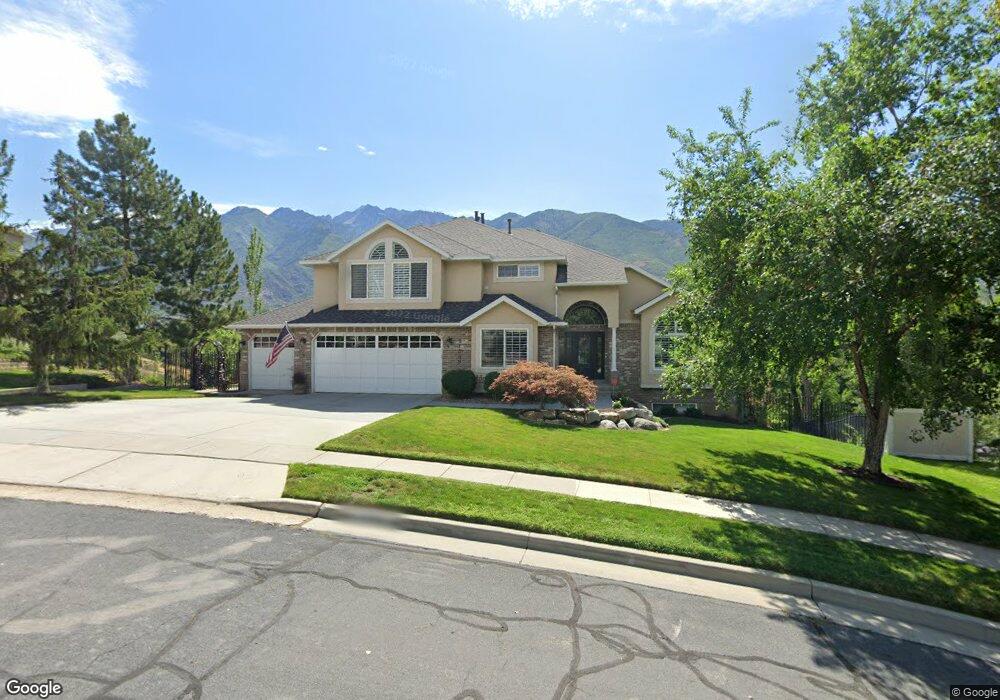
This home is located at 11559 S Gracey Ln, Sandy, UT 84092 and is currently estimated at $1,142,204, approximately $236 per square foot. 11559 S Gracey Ln is a home located in Salt Lake County with nearby schools including Sunrise Elementary School, Bell Canyon Montessori School, and Gateway Academy.
Ownership History
Date
Name
Owned For
Owner Type
Purchase Details
Closed on
Apr 3, 2025
Sold by
Flores Robert L and Flores Mary K
Bought by
Rkdn Trust and Flores
Current Estimated Value
Purchase Details
Closed on
Jun 26, 2013
Sold by
Anderson Michal Morton
Bought by
Flores Mary K and Flores Rober L
Home Financials for this Owner
Home Financials are based on the most recent Mortgage that was taken out on this home.
Original Mortgage
$497,161
Interest Rate
3.48%
Mortgage Type
FHA
Purchase Details
Closed on
Jan 10, 2007
Sold by
Anderson Robert W and Anderson Sandra J
Bought by
Anderson Robert Weston and Anderson Sandra Jean
Purchase Details
Closed on
Mar 16, 1994
Sold by
Jkl Enterprises Inc
Bought by
Anderson Robert W and Anderson Sandra J
Create a Home Valuation Report for This Property
The Home Valuation Report is an in-depth analysis detailing your home's value as well as a comparison with similar homes in the area
Home Values in the Area
Average Home Value in this Area
Purchase History
| Date | Buyer | Sale Price | Title Company |
|---|---|---|---|
| Rkdn Trust | -- | None Listed On Document | |
| Flores Mary K | -- | First American Title Co Llc | |
| Anderson Robert Weston | -- | Accommodation | |
| Anderson Robert W | -- | -- |
Source: Public Records
Mortgage History
| Date | Status | Borrower | Loan Amount |
|---|---|---|---|
| Previous Owner | Flores Mary K | $497,161 |
Source: Public Records
Tax History Compared to Growth
Tax History
| Year | Tax Paid | Tax Assessment Tax Assessment Total Assessment is a certain percentage of the fair market value that is determined by local assessors to be the total taxable value of land and additions on the property. | Land | Improvement |
|---|---|---|---|---|
| 2025 | $5,102 | $1,013,600 | $264,400 | $749,200 |
| 2024 | $5,102 | $964,600 | $254,500 | $710,100 |
| 2023 | $5,102 | $891,000 | $244,700 | $646,300 |
| 2022 | $4,409 | $814,400 | $239,900 | $574,500 |
| 2021 | $3,957 | $622,400 | $208,600 | $413,800 |
| 2020 | $3,920 | $561,500 | $201,100 | $360,400 |
| 2019 | $4,102 | $561,400 | $189,700 | $371,700 |
| 2018 | $3,798 | $558,700 | $189,700 | $369,000 |
| 2017 | $3,645 | $513,000 | $189,700 | $323,300 |
| 2016 | $3,366 | $472,600 | $189,700 | $282,900 |
| 2015 | $3,826 | $491,000 | $201,100 | $289,900 |
| 2014 | $3,646 | $466,200 | $195,400 | $270,800 |
Source: Public Records
Map
Nearby Homes
- 1937 Wasatch Blvd
- 11778 S 1700 E
- 1612 E Hidden Valley Rd
- 11545 S Hagan Rd
- 11415 S Hagan Rd
- 1644 Pebble Beach Cir
- 2234 E Willow Brook Way
- 15 Lone Hollow Dr
- 11065 Longdale Cir
- 1481 Noelle Rd
- 11343 Clifford Cir
- 11731 S Canberra Dr
- 11922 S Bluff View Dr
- 2026 E Tivoli Hills Ct
- 11966 Bluff View Dr
- 11139 S 1330 E
- 12182 S Pine Valley Way
- 1234 E Sandy Ridge Dr
- 10868 Prescott Dr
- 11081 S 1280 E
- 11559 Gracey Ln
- 1824 Gracey Ln
- 1824 E Gracey Ln
- 1819 E Gracey Ln
- 1819 E Gracey Ln
- 11549 Gracey Ln
- 1812 Gracey Ln
- 1812 E Gracey Ln
- 1818 Gracey Ln
- 1811 E Gracey Ln
- 1811 Gracey Ln
- 1850 Gracey Ln
- 1802 E Gracey Ln
- 1802 Gracey Ln
- 1801 Gracey Ln
- 1797 E Cornwall Ct
- 1797 Cornwall Ct
- 1858 Gracey Ln
- 1824 E 11400 S
- 1794 Gracey Ln